Biomedical Engineering Reference
In-Depth Information
20 nm TiO
2
nanoparticles is taken as comparison, representing
the current state of the art inorganic nanostructure in DSCs. The
predicted geometric surface areas (Table 2.3) expressed as the
surface enhancement (or
) per micron in array
thickness, are comparable for the three arrays; 100, 125, and 120
for wires, gyroid and nanoparticles, respectively. We expect the
primary difference between the morphologies to lie rather in the
dimensionality of charge transport out of the array. Standing wires
offer direct and, in principle, independent extraction pathways while
gyroid and nanoparticle layers privide an ordered or disordered 3D
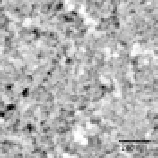
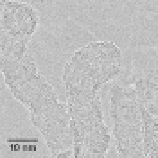
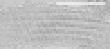
network of routes, respectively. The TiO
roughness factor (RF)
crystal phase (indexed
in all cases to anatase) and characteristic grain size in each of the
three morphologies is shown by high resolution transmission
electron microscopy (Fig. 2.26). In both electrochemically replicated
morphologies the grain size is of the same order as the structural
confinement (∼10 nm). Crystallite dimensions in nanowire
templated structures may exceed this confinement length along the
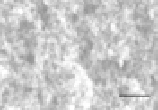
wire axis in some places (Fig. 2.26g, inset). The nanoparticle network
(Fig. 2.26c) is made up of ∼20 nm randomly contacted single-
crystal nanoparticles.
February 8, 2010 17:21
2
(a)
(b)
(c)
(c)
(d)
(e)
(f)
200 nm
200 nm
200 nm
(g)
(h)
(i)
10 nm
10 nm
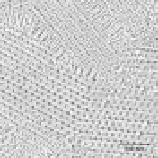
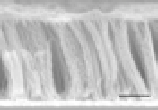
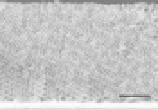
nanostructures. (a-f )
Top and cross-sectional SEM perspectives of standing nanowire, gyroid
network and sintered nanoparticle mesoporous layers. (g-i) Corresponding
high resolution TEM images. Reproduced with permission from Ref. [56].
Figure 2.26
Electron microscopy summary of TiO
2


Search WWH ::

Custom Search