Biology Reference
In-Depth Information
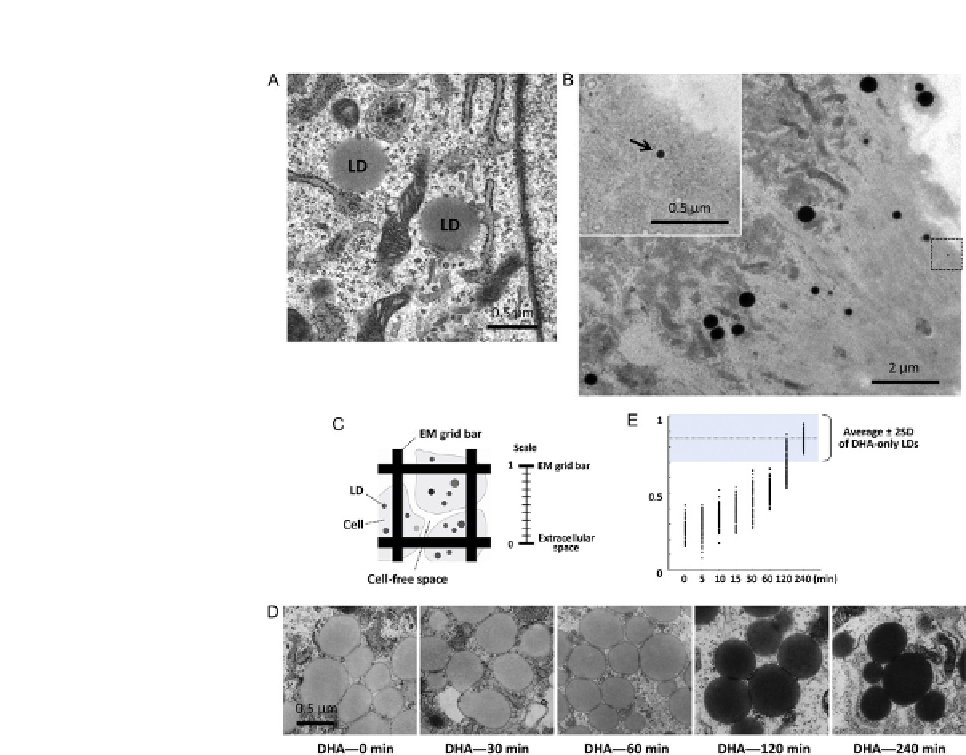
FIGURE 13.2
Ultrathin section EM to examine the LD core. (A) LDs in rat fibroblasts cultured in the normal
medium. The core of LDs is of low to medium electron density and the LD surface is not seen as
a distinct line. (B) Rat fibroblasts are depleted of LDs by culturing in a lipoprotein-deficient
medium and then treated with DHA 2 h before fixation. LDs thus generated are made of
DHA esters and show a high electron density. This makes LDs stand out and even LDs much
smaller than 100 nm in diameter can be identified unambiguously. Inset shows a high
magnification of the LD in the square (arrow). (C-E) Rat fibroblasts are first depleted
of endogenous LDs and then cultured with OA so that they have LDs of a relatively low electron
density. OA is switched to DHA and cells are fixed sequentially. (C) The electron density
of LDs can be measured objectively by using the relative scale. In each image, the electron
density of a grid bar and a cell-free space is set as one and zero, respectively. (D) The electron
density of existing LDs increases gradually and synchronously as a result of the DHA treatment.
(E) The bar graph shows the relative electron density of LDs measured by using the scale
in (D). The shaded zone indicates the electron density of LDs (mean2 SD) in cells treated with
DHA alone for 12 h. Note that LDs showing the electron density of DHA-only LDs (as seen
in (B)) do not occur as an independent population. The result indicates that the newly formed
DHA ester does not make LDs on its own but is incorporated into existing LDs.