Biology Reference
In-Depth Information
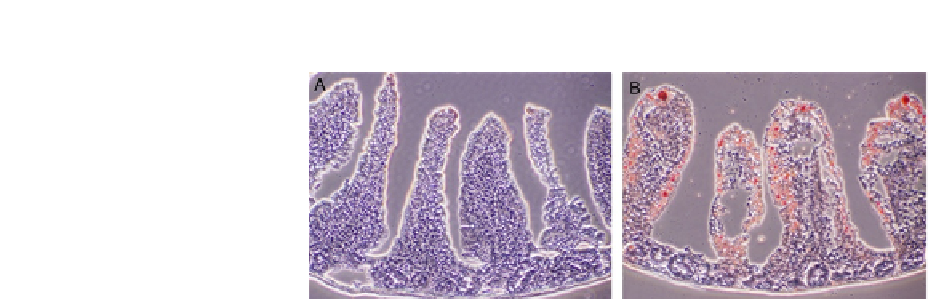
FIGURE 9.3
Oil Red O images of the jejunum in mice. (A) High fat-fed mouse that has euthanized after an
overnight fast (16 h). (B) High fat-fed mouse that has been euthanized in the fed state
(2 h after the start of the light cycle).
9.1.3
Assessing dietary fat absorption
Capturing CLDs in enterocytes of the small intestine is complicated because of its
dynamic nature. CLDs initially increase after a meal, but then decrease over time
in part due to the secretion of TAG into circulation. Three important physiological
and biochemical aspects of dietary fat absorption that are valuable to fully appreciate
the images obtained include (1) intestinal TAG concentration, (2) quantitative dietary
fat absorption, and (3) postprandial triglyceridemic response/intestinal TAG secretion.
9.1.3.1
Biochemical TAG quantification in intestinal mucosa
Biochemical determination of TAG concentration in intestinal mucosa provides a
quantitative number to reflect results observed in imaging.
9.1.3.1.1
Materials
1.
Polytron homogenizer
2.
Vortex
3.
UV-Vis microplate spectrophotometer
4.
1 M Tris-HCl pH 7.4
5.
HIP solution (hexane:isopropanol 3:2)
6.
L-Type TG Measuring Kit (Wako)
7.
BCA assay (Pierce)
8.
15 ml glass test tubes
9.
Glass pasteur pipettes and rubber bulbs
10.
96-well plates
11.
Nitrogen flow
9.1.3.1.2
Methods
1.
Clean the desired sections of the small intestine as described in
Section 1.1
. Cut
open the small intestine longitudinally on a clean, glass plate resting on ice. Any