Environmental Engineering Reference
In-Depth Information
two 5
5m isolated plots within the tree planted
shelterbelt and that from the previously discussed
improved pasture, a 71% and 66% reduction
occurred in the plots under trees collected over a
10-month period (Marshall et al. 2009).
observed, possibly as a result of the increase in
development of preferential flow paths in the
spring and summer caused by the soil cracking
and development of earthworm channels. During
winter, a gradual decrease in the effectiveness
of these preferential flow pathways is observed,
presumably as they begin to deteriorate. This re-
sults in an increase in the relative importance
of overland flow. This is illustrated by compar-
ing the difference in drain flow response for the
three events shown in Figure 3.4. The results
demonstrate the need for long-term monitoring
in order to capture the annual and interannual
changes in runoff response as result of climatic
variability.
Differences in soil properties are observed at the
instrumented hillslope comparing soil under im-
proved pasture and that under an established tree
shelterbelt. A significant increase in the saturated
hydraulic conductivity is measured in the A ho-
rizon of soil under trees compared with that of the
same soil type under improved pasture. There is
also a change in the soil moisture release curve,
with the soil under trees showing an increase in
available pore space between saturation and field
capacity (
Y
¼
100 cmH
2
O; Rowell 1994). There
was, however, little difference in the B horizon
between land uses. Carroll et al. (2004) found a
significant increase in soil infiltration rates at
Pontbren due to the presence of trees and/or the
absence of sheep. Comparing overland flow from
Catchment-scale response
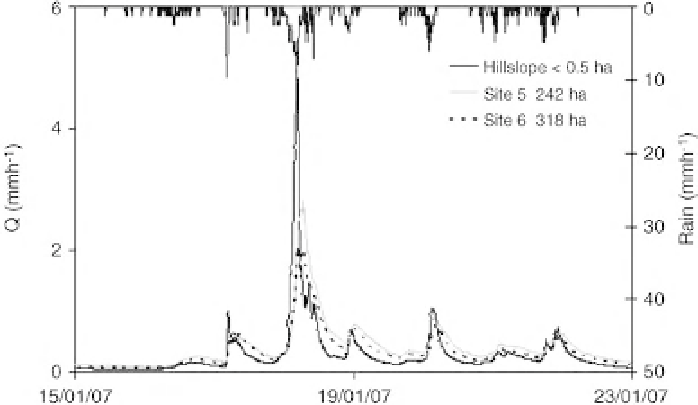
A clear similarity in runoff response is observed
comparing total runoff (drain flow and overland
flow combined) from the instrumented hillslope
under improved pasture with hydrographs mea-
sured at gauging sites on the Nant Pen y cwm
stream (Fig. 3.5; see also Fig. 3.1). Onemight expect
this to be due to the close proximity of the sites and
the fact that a large proportion of the land draining
to these sites is under improved grassland produc-
tion (see Table 3.1). When moving from the hill-
slope scale to the streamflownetworka decrease in
flood peak (per unit area) is measured as a result of
increasing variability in travel times.
However, differences in stream flow response
are observed by comparing subcatchments within
Pontbren where the land use is significantly
different. Figure 3.6 shows the hydrograph of
a significant runoff event for gauging sites 6 and
9 (see Fig. 3.1). The peak runoff rate at site 9 ismuch
reduced compared to that of site 6. As opposed to
Nant Pen y cwm, the Nant Melin y grug subcatch-
ment has remained relatively unchanged, with
much of the land still managed as unimproved
Fig. 3.5
Standardized total runoff
(Q) (drain flow and OLF), from the
improved pasture hillslope and
stream flow response from
gauging sites 5 and 6.