Environmental Engineering Reference
In-Depth Information
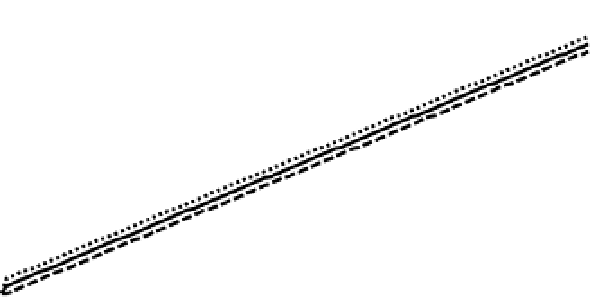
Figure 16.14 illustrates an example of the re-
quired input, with the black solid line indicating
the best assessment, and the degree of uncertainty
shown by the dotted and the dashed lines. Hence,
in this example, the cliffs are expected to erode
inland by an average distance of 102m over the
next 100 years, although there is potential that
the cliffs could erode by as little as 100m, or by as
much as 115m over the next 100 years.
For example, at a well-monitored site it may be
appropriate to use a quantitative model to predict
cliff erosion rates. Conversely, in a situation
where there is little or no recorded information,
local knowledge and engineering judgement are
necessary.
Irrespective of the simplicity or complexity of
the techniques, each should lead to the same basic
output: a timeline to cliff erosion and a timeline to
defence failure. The principal difference between
the outputs from various techniques is the accu-
racy and the level of confidence.
The general idea is to define, by means of a
probabilistic description of failure and erosion,
a probability of erosion for a given distance or
time, which considers the interaction of both ele-
ments, the natural process of cliff erosion, and the
presence or not of a coastal structure.
Coastal defence assessment procedure
In a similar manner, the probability of defence
failure can be determined. In all cases, taking
account of the influence of defences has two
components:
.
a general deterioration over time, i.e. due to
general wear and tear at some point in the future
it will cease to be effective;
.
a failure of the defence due to design conditions
being exceeded, e.g. destroyedby a storm, or under-
mined by falling beach levels (forcing conditions).
Risk assessment of cliff erosion
With regard to cliff erosion there is uncertainty
over when the cliff will erode, by how much and
if this would be instantaneous or gradual. With
regard to resistance to cliff instability, there is the
impact of failure of coastal defences and sea level
rise.
The key components to determine the erosion
versus time plot are cliff instability and the ero-
sion process. These curves might be generated
on the basis of detailed cliff erosion models, on
extrapolation of historical erosion rates, or local
knowledge and engineering judgement.
Both of these are variable but in different ways.
With regard to deterioration there is uncertainty
over the time at which the defence will become
ineffective, and indeed if this would be instanta-
neous or gradual. Failures resulting from environ-
mental conditions can be determined from an
annual probability of exceedence.
Factors including climate change and along-
shore interactions can also be incorporated
into any of the techniques using appropriate
120
100
80
60
40
uncertainty (worst)
most likely
unc
er
tainty (
b
est)
20
0
0
10
20
30
40
50
60
70
80
90
100
Time (years)
Fig. 16.14
Erosion profiles.


