Environmental Engineering Reference
In-Depth Information
(
a)
(b
)
0.15
0.3
0.1
0.2
0.05
0.1
0
0
-0.05
-0.1
-0.1
-0.2
-0.15
-0.3
-0.2
-0.4
0
200
400
600
800
1000
0
1
2
3
4
Cross-shore distance (m)
Wave Height (m)
E1
E2
E3
E1
E2
E3
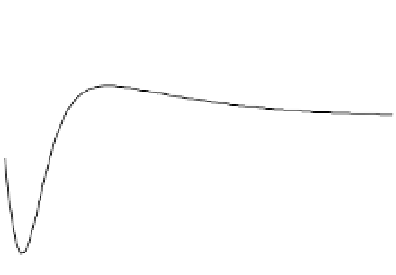
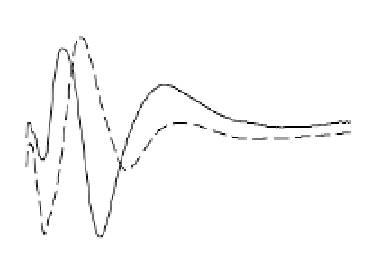
Fig. 16.8
The first three empirical orthogonal functions (EOFs: E
1
E
3
) determined from measured (a) beach profiles
and (b) probability density functions for nearshore wave height.
deviations may also be expected at other sites and,
if important for the particular design question, the
nature of the deviation should be investigated at
other sites.
Mode H
1
shows the profile elevation that is
related with variations in the composite wave pdf
as given by G
1
. Accordingly, H
1
implies a general
decrease across the profile when G
1
causes a de-
crease or increase in the wave pdf. The higher
modes H
2
and H
3
are associated with more com-
plex changes in thewave pdf determined byG
2
and
G
3
. In order to investigate further the predictive
capability of CCA, regression matrices derived
from the datasets on profiles and waves up to
December 2003 were used to define the correla-
tions between waves and profiles. To make a
forecast, measured wave conditions from Decem-
ber 2003 onwards were used together with the
correlations to forecast a time series of profiles
using the first five CCA modes.
Figure 16.10 shows the measured beach profile
and the predicted beach profile made at the profile
line 62 for 27 April 2004. Good overall agreement
is obtained. The elevation of the bar is underesti-
mated by the prediction and is also shifted slightly
towards the shore. A possible cause is that the
Rayleigh distribution limits the occurrence of
higher waves. That is, in practice there are a
greater number of higher waves than predicted by
the Rayleigh distribution.
The output from this case is perhaps more of
a site-specific insight into how reality deviates
from general assumption. A corollary is that such
Case Study: Uncertainties in
Morphological Models
The central concern of morphodynamics is to
determine the evolution of bed levels for hydro-
dynamic systems such as rivers, estuaries, inlets,
bays and other nearshore regions where fluid flows
interact with, and induce significant changes to,
bed geometry. The goal of this section is to de-
scribe some sources of uncertainty within an al-
gorithm for computing bed level change.
Numerical morphological models involve cou-
pling between a hydrodynamic model, which pro-
vides a description of the flow field leading to a
specification of local sediment transport rates,
and an equation for bed level change, which ex-
presses the conservative balance of sediment vol-
ume and its continual redistribution with time
(see Fig. 16.3).
The majority of the numerical models that
have been developed are based on a series of mod-
ules that describe the hydrodynamics, sediment
transport and bed evolution separately. The