Environmental Engineering Reference
In-Depth Information
t
=
0
t
T
=
syn
l
+
1
t
=
T
syn
l
Synchronized
Synchronized
t
Δ
2d
m
=
∑
m
i
t
=
Δ
t
2d
1
i
Synchronized
Unsynchronized
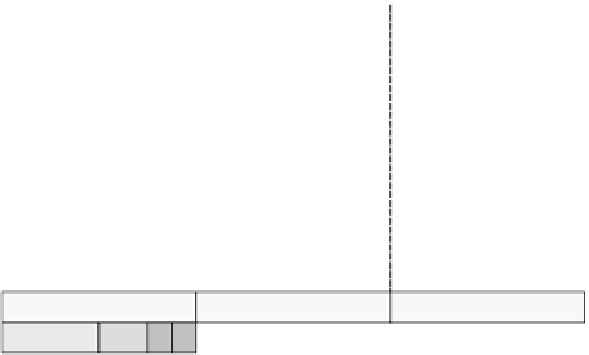
Fig. 13.17
Synchronized and unsynchronized timing between 1D and 2D models. See text for explanation of terms.
of total length of 6.0 km. The boundaries to the
north and east of the catchment were set by the
River Aire and one of its tributaries, and by a
railway to the south and a major road to the west.
The DEMwith buildings for the study area was
constructed using LiDAR data at a 2
2m grid
spacing, as shown in Figure 13.19. The overall
sewer network is also shown in Figure 13.19 but
for the purposes of the comparative study a section
of the system, with catchment area 0.2 km
2
con-
taining 74 pipes of total length 3.0 km, also shown
on Figure 13.19, was the subject of the case study.
The 2D surface terrain was schematized as a
series of ponds connected by pathways in the 1D/
Fig. 13.18
Aerial photo of the study areas: Stockbridge inKeighley, West Yorkshire. (See colour version of this figure in
Colour Plate section)