Environmental Engineering Reference
In-Depth Information
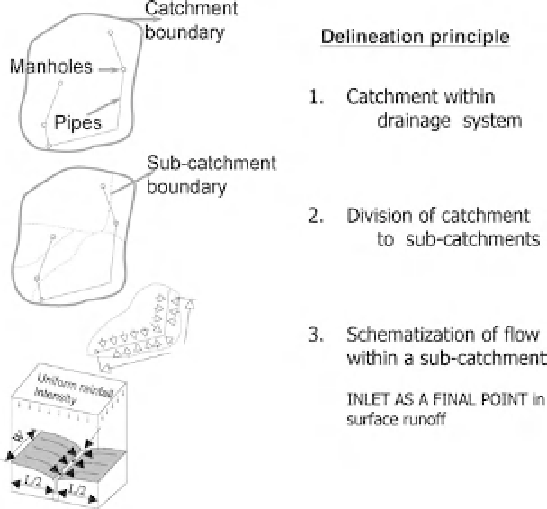
Fig. 13.7
Subcatchment delineation. L
¼
catchment
length, W
¼
catchment width. (See colour version of
this figure in Colour Plate section)
are used to define the drainage capacity of the
surface flowpaths. Modelling of flow in surface
pathways requires the following information:
.
the geometry of the open-channel drainage on
the surface;
.
upstream/downstream elevations;
.
roughness;
.
the actual length along the pathway between
two ponds or surface nodes.
The overall process is presented in Figure 13.10.
The algorithm uses the preferential flowpaths
derived from the DEM and constructs channel
cross-sections equidistant along the length of each
pathway (Fig. 13.10b). The DEM is also used to
estimate the surface area of each cross-section,
which is then transformed into (represented by)
a trapezoidal or natural section. This channel is
then used to route the flood flow over the catch-
ment surface by taking into account the average
flow areas at different depths along the length of
each pathway (so-called 'stage-flow area' curve).
These, together with the values of the average
channel slope (based on the upstream and down-
stream channel elevation and the length of
Sub-catchment
out
11.0
12.0
14.0
14.0 15.0 14.0
15.0
15.0
16.0
Undrained area
11.0
13.0 12.0
13.0 13.0
11.0
15.0
in
10.0
17.0
M
Pipe
M
Pipe
M
anh
10.0
18.0
11.0
14.0 15.0 16.0
18.0
Sub-catchment
boundary
12.0 13.0
17.0 18.0 18.0
19.0
Pipes
Manholes
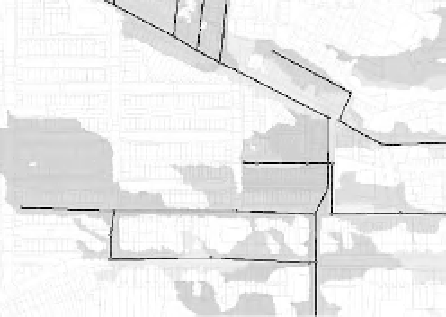
Fig. 13.8
Link based approach to determine sub-catchment delineation. (See colour version of this figure in Colour
Plate section)