Environmental Engineering Reference
In-Depth Information
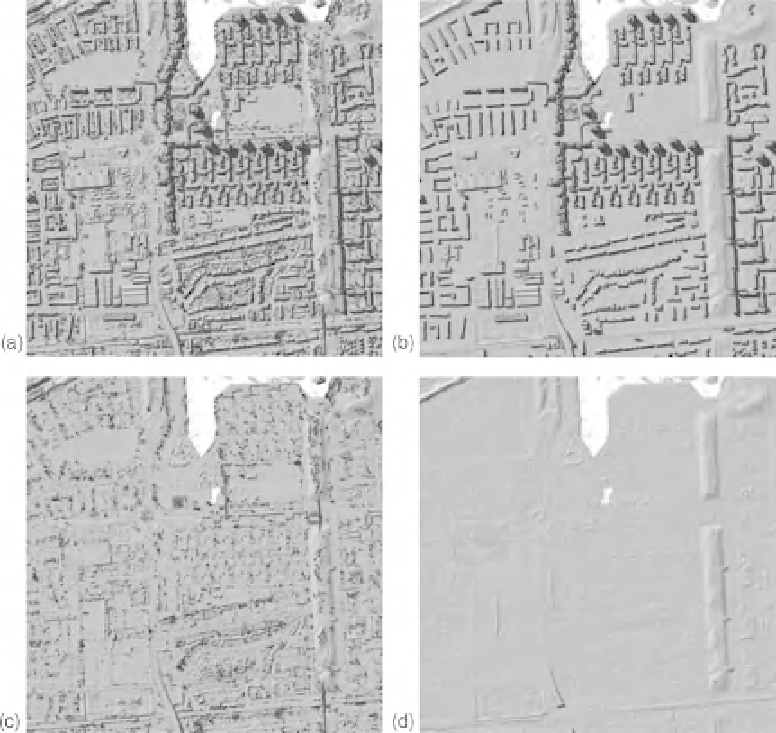
Fig. 11.2
Exampleof theEnvironmentAgencyGeomatricssGroup'shybridfiltering. (a) Digital SurfaceModel; (b) Digital
Terrain Model (DTM) with buildings; (c) DTM with vegetation; and (d) DTM without bridges. Reproduced with
permission of Geomatrics Group, Environment Agency. (See the colour version of this figure in Colour Plate section.)
impact of zones of high friction but limited
spatial extent (e.g. hedges) is not lost by averaging
over a larger neighbourhood. The simulated
hydraulics using the decomposed mesh gave
a better representation of the observed flood extent
than the traditional approach using a constant
floodplain friction factor. The above technique
has been extended for use in urbanfloodmodelling
using a LIDAR post-processor based on the
fusion of LIDAR and digital map data (Mason
et al. 2007a). The map data were used in conjunc-
tion with LIDAR data to identify different object
types in urban areas, in particular buildings, roads
and trees (Fig. 11.3).
Integrating LIDAR data into a flood
inundation model
A problem with integrating LIDAR data as ba-
thymetry into a flood inundation model is that
the LIDAR data generally have a higher spatial
resolution than the model grid. Marks and
Bates (2000), who were the first to employ LIDAR
as bathymetry in a 2-D model, coped with this by
using the average of the four central LIDAR
heights in a grid cell as the topographic height for
the cell. Bates (2000) also used LIDAR in a subgrid
parameterization in order to develop an improved
wetting-drying algorithm for partially-wet grid