Environmental Engineering Reference
In-Depth Information
0
20000
1
0
18000
2
0
16000
Predictions
Error Free
3
0
Original Data
Prediction Applying -SVR
Rainfall
16000
14000
4
0
5
0
12000
14000
6
0
10000
7
0
12000
RMSE: 9
.
09161 × 10
2
m
3
/ s
8000
8
0
6000
9
0
10000
1
00
4000
8000
1
10
2000
1
20
6000
0
1
30
−2000
1
40
0
2000
4000
6000
8000
10000 12000 14000 16000
4000
Actual Value
1
50
1
60
2000
1
70
1
80
0
1
90
−2000
200
100
200
300
400
500
600
700
800
900
1000
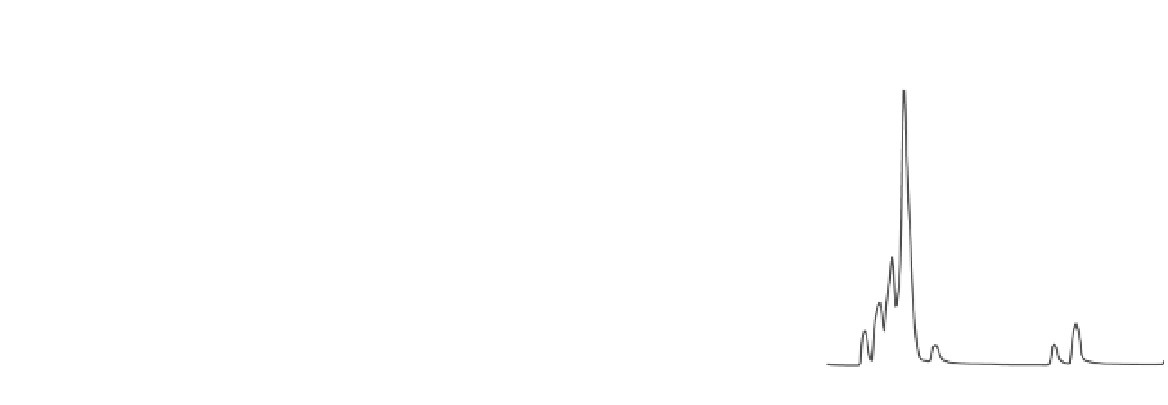
6 Hourly Intervals From November 1974, 12:00 hours, to December 1974, 12:00 hours
Fig. 8.8
Plots comparing actual flow against predicted flow applying an
e
- SVR (Randon et al. 2004). (See the colour version of this figure in Colour
Plate section.)