Geography Reference
In-Depth Information
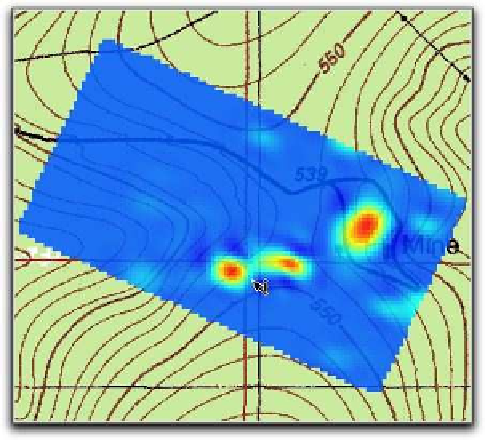
Figure 4.7: Grid of silver values in pseudocolor
Range
3.9615553319
Mean
0.3253868880
Sum of Squares
991.8232408759
Standard Deviation
0.4478514579
Sum of All Cells
1609.3635482636
Cell Count
4946
This tells us the minimum and maximum values in the grid, the num-
ber of cells, the range, and some other statistics. This is probably a bet-
ter way to get a quick overview of the distribution of a grid, as opposed
to randomly identifying cells.
To make the display a bit more dramatic, we can open the raster prop-
erties dialog box and change the color map from grayscale to pseudo-
Now the high value areas are red and the low values are blue, making
it even easier to visually analyze the distribution of the values.
We could take our analysis further by using GRASS to create a con-
tour map of the cell values or by generating a hillshade to enhance the
appearance of the map.


Search WWH ::

Custom Search