Geography Reference
In-Depth Information
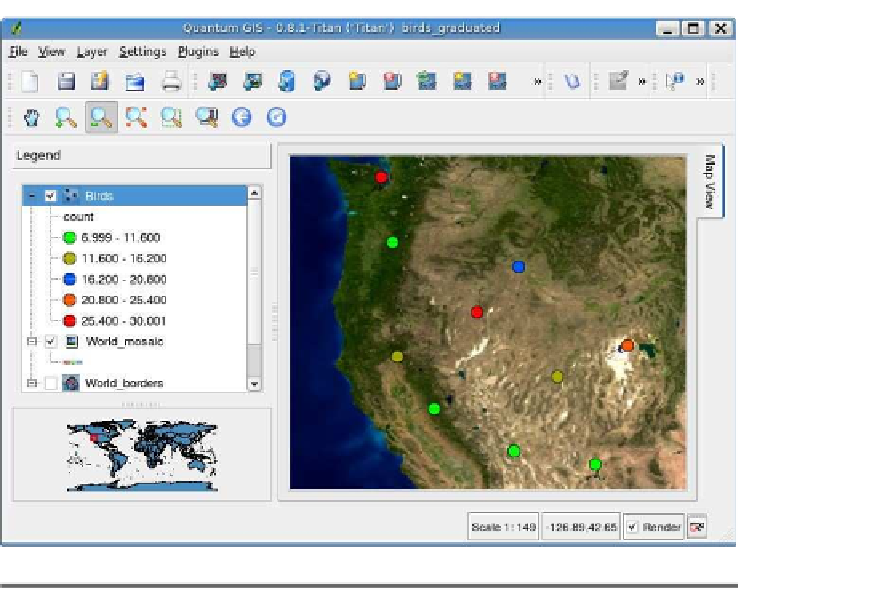
Figure 3.12: QGIS graduated renderer results
In our settings, we specified the sites with the highest bird counts
should be a dark red color, while those with the least are rendered
a green or tan color. As a result, you can see a lot of green dots in Fig-
granular view of the counts, we would need to increase the number of
classes. Another way to refine the rendering is to edit the values in the
class breaks. QGIS allows you to edit the ranges used for each class by
the preceding page). You can adjust the ranges for each class to get the
result you want.
The graduated renderer gives us (and Harrison) a quick way to spot the
locations with the highest bird count, just by looking at the colors of
the dots on the map. We could create an even more effective display
by changing the symbol size of the dots for each class, starting with
a smaller point size and increasing to a much larger size for the last
class. In this way, the size of the dots conveys the relative number of
birds at each site, and you can get a very quick idea of the distribution
with just a glance.


Search WWH ::

Custom Search