Geography Reference
In-Depth Information
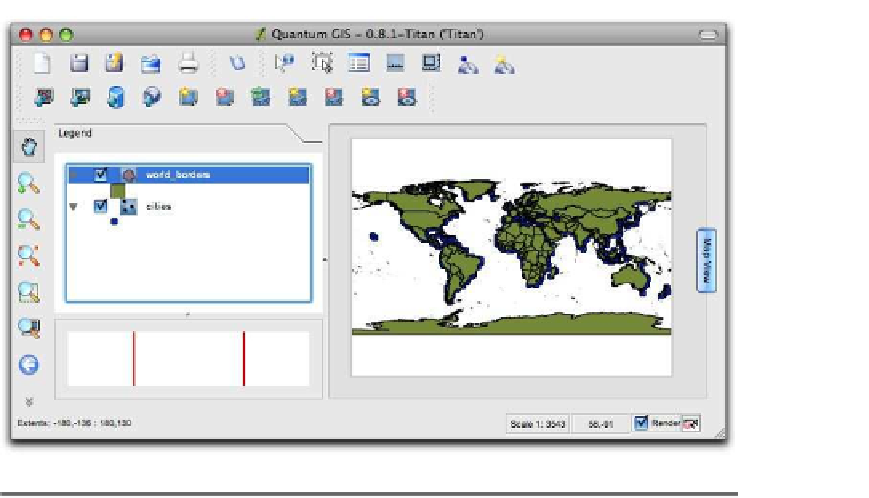
Figure 3.6: QGIS with sample data loaded (OS X)
one layer to the map. Select both the
world_borders
and
cities
shapefiles,
and click the Open button to load them. If you don't see the shapefiles
in the file dialog box, make sure the filter (Files of Type) selector is set
to display ESRI Shapefiles.
You might notice something right off, apart from the atrocious colors
QGIS has chosen for our two layers. The
cities
layer is “underneath” the
world borders. This is because QGIS isn't very clever in loading layers
and didn't know it should put your point data on top of your polygon
data. We can easily fix this by dragging the
cities
layer to the top of
the list in the legend. That solves the ordering problem, but the colors
are still bothersome. Fortunately, QGIS has a wide range of options for
symbolizing layers.
Fixing the Appearance
To fix the layers, we will use the Layer Properties dialog box. You can
access the dialog box by double-clicking a layer or by right-clicking
and choosing
Properties
from the pop-up menu. Let's start by modifying
page, there is the somewhat busy Layer Properties dialog box and the


Search WWH ::

Custom Search