Geography Reference
In-Depth Information
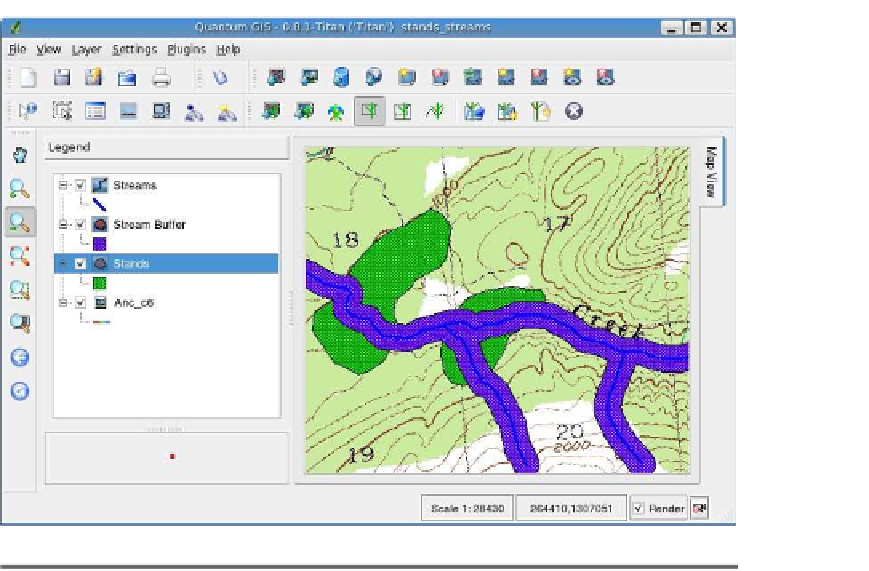
Figure 12.12: Timber stands and stream buffers
where the likely “no logging” areas are, but by doing the analysis we
will be able visualize it to aid in making decisions.
Now to subtract the portions of the stands that are not eligible for log-
ging. To do this, we use the Vector Subtraction module and enter the
name of the stands map as the first vector input map on the module
input screen. The stream buffer map is entered as the second vector
map. Then we specify a name for the output map. Since it will contain
polygons of the eligible areas, we'll name it
eligible_stands
. We click the
Run button, and off we go. The result of this operation is shown in
You can see from the results that the upstream stand has been carved
up into three fairly small pieces, one of which is between a fork in the
stream. If we pretend to know something about logging, we might say
that the upstream stand (the one to the right) doesn't look like it's too
promising in terms of both size and location. The downstream stand
has been cut in two but is still fairly sizeable. This example serves to
show how the vector overlay modules can be used for visual analysis


Search WWH ::

Custom Search