Geoscience Reference
In-Depth Information
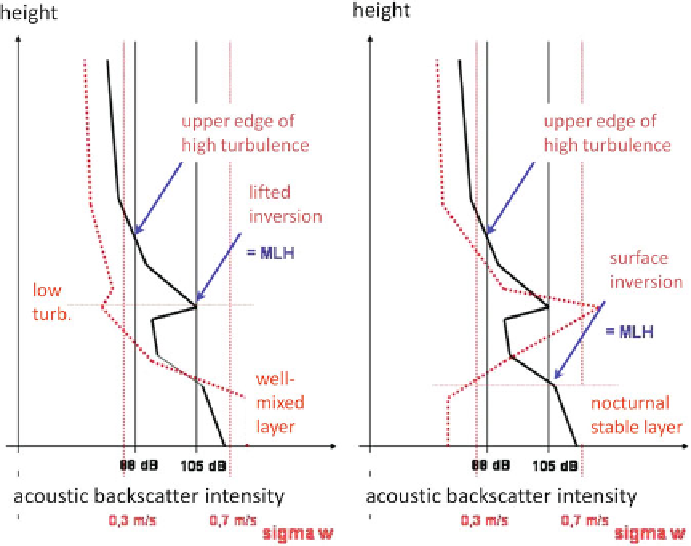
Fig. 4.2
Schematic of the determination of MLH from SODAR measurements.
Full black curve
:
acoustic backscatter intensity in dB,
dotted red curve
: vertical profile of
σ
w
.
Left
:examplefora
daytime convective boundary layer,
right
: example for a stable nocturnal boundary layer. Vertical
black
and
red lines
indicate threshold values used in eqs. (
4.1
)to(
4.3
)
from the analysis of the vertical aerosol distribution. This also includes the assump-
tion that the vertical aerosol distribution is not dominated by horizontally advected
aerosol plumes or layers. The heights of the near surface aerosol layers (
H
4
_n
)
can be analyzed from the optical vertical backscatter profile obtained from opti-
cal remote sensing. Several methods have been developed, the most prominent of
these being: (1) the threshold method, (2) the gradient or derivative method, (3) the
idealized gradient method, (4) the wavelet method, and (5) the variance method.
The application of optical remote sensing for MLH determination has focussed
on the use of ceilometers in recent years. Ceilometers can be regarded as a small
LIDAR. They are simpler and they have a much lower lowest range gate than
LIDARs. For the detection of MLH below 150-200 m, a ceilometer with one opti-
cal axis for the emitted and the received beam should be used. Due to the thin light
beams the overlap of the emitted and received beam from a ceilometer with two par-
allel optical axes can be insufficient in this height range. Further on, Doppler shifts
are not analyzed by ceilometers. Therefore, in contrast to acoustic remote sensing
with Doppler-SODARs, additional variables in addition to the backscatter inten-
sity are not available from ceilometers for the design of determination schemes for
Search WWH ::

Custom Search