Geoscience Reference
In-Depth Information
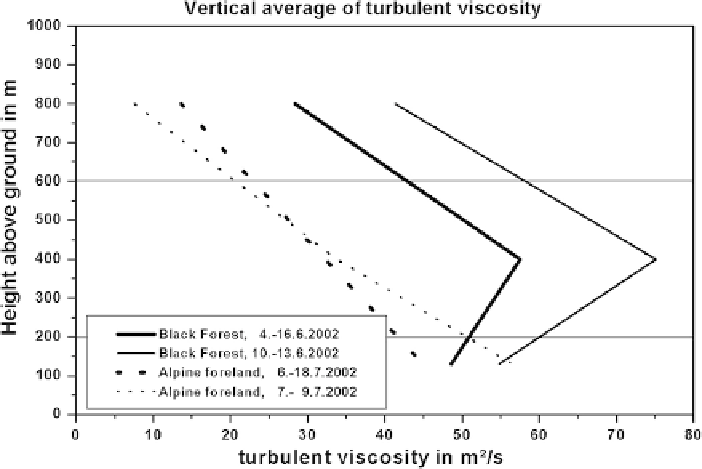
Fig. 4.31
Vertical profiles of turbulent viscosity from SODAR measurements using eq. (
4.22
)for
flat terrain (
dashed
and
dotted lines
) and for mountainous terrain (
thin
and
thick full lines
)
clear calm nights it is also due to increased wind shear. This indicates that the over-
all thermal stability of the air is primarily controlling the magnitude of turbulent
viscosity.
Figure
4.31
compares vertical profiles of the turbulent viscosity, which have been
computed in the abovementioned manner for a flat pre-Alpine region and for moun-
tainous terrain (the sounding has been made near a hill-top in the Black Forest in
South-western Germany). For each terrain type two evaluations are presented, which
look consistent. Turbulent viscosity - and thus the vertical momentum exchange -
is larger over mountainous terrain than over flat terrain. Probably, small-scale sec-
ondary circulation patterns due to dynamic and thermal forcing on the hill slopes
enhances the standard deviation of the vertical wind component without influencing
the overall vertical wind shear so much. Therefore, according to (
4.22
), the turbulent
viscosity above mountainous terrain turns out higher than over flat terrain.
4.4.2 Heat Flux
A method to compute the heat flux via variances from wind profiler/RASS measure-
ments is described and compared to a derivation from an eddy-correlation technique
using data from the same instruments and to airborne in-situ measurements in Bange
et al. (
2002
). The shown examples in this paper compare well with independent mea-
surements and modelled profiles. The variance method determines the turbulent heat
Search WWH ::

Custom Search