Geoscience Reference
In-Depth Information
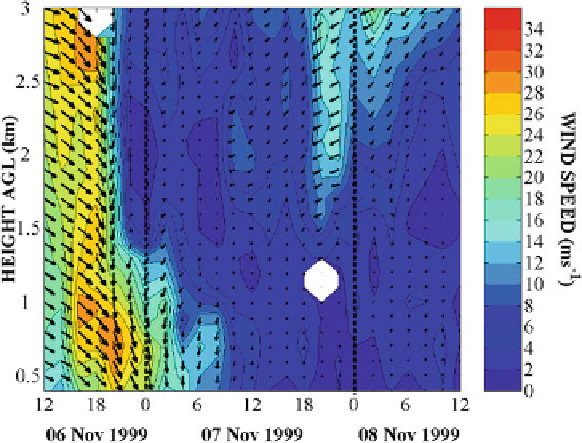
Fig. 4.18
Time-height cross section of horizontal wind from UHF windprofiler measurements.
The
colours
code the wind speed, the
arrows
give the wind direction (from Caccia et al.
2004
).
Times are in UTC (roughly local time).
Vertical dotted lines
indicate midnight.
White areas
denote
missing data
Besides RASS and Raman LIDAR, a third active technique is presently tested
and may become available for the determination of tropospheric temperature pro-
files: high spectral resolution LIDAR (HSRL). This HSRL technique is resolving
the temperature dependent line width of the Cabannes line, which is Doppler-
broadened. This technique poses much higher demands in respect to the stability
of the system as shown in Hair et al. (
2001
) than a Raman LIDAR (Radlach et al.
2008
). Therefore, its operation is probably restricted to limited research projects.
4.3.2.1 RASS
Temperature measurements with the highest vertical resolution can be achieved with
Doppler-RASS or SODAR-RASS measurements. This technique offers temperature
profiles with about 20 m vertical resolution for several hundreds of metres above
ground. Figure
4.5
shows an example of RASS measurements of potential tempera-
ture for a spring episode of three consecutive days. The diurnal variation from cool
nights with stable stratification (potential temperature is increasing with height) and
warm days with a well-mixed convective boundary layer (potential temperature is
constant with height) can easily be identified. On the first day, the well-mixed period
lasts from 2 p.m. to 7 p.m. CET (roughly local time minus one hour); on the other
two days the well-mixed period is observable from noon to 7 pm. After 7 pm a new
stable nocturnal surface layer starts to form, which persists throughout the night and
the morning of the next day.
Search WWH ::

Custom Search