Geoscience Reference
In-Depth Information
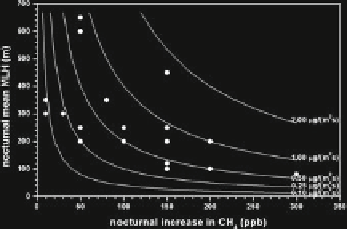
g/(m
2
s
−
1
)frompath-
averaged FTIR methane concentration measurements (
upper left
, time series for seven consecutive
days in May 2003) in ppm and mixing layer heights derived from SODAR measurements (
upper
right
, same time period as for the methane concentrations in the upper left frame) in m
Fig. 4.8
Methane emission rates (below, for 18 nights in May 2003) in
μ
same type of hyperbolic behaviour that we have also noticed in Fig.
4.7
. Comparison
of the methane and the MLH time series clearly indicates that the largest methane
concentration increases happen during the nights with the lowest MLH. The order
of magnitude of the deduced areal emission rates fits to the nationwide German
methane emission rates as documented in the Kyoto protocol compliance reports.
4.2.2 Boundary Layer Height
Often, the boundary layer consists of more layers than just the mixing layer. For
example, at night, a residual layer may persist over a newly formed near-surface
stable surface layer. The combined deployment of a SODAR and a ceilometer (see
section “Combined Deployment of SODAR and Ceilometer”) may be a choice to
detect such features. Such a combination of parallel measurements of the verti-
cal structure of the atmospheric boundary layer by a ceilometer and a SODAR is
described in Emeis and Schäfer (
2006
). Figure
4.9
, which is taken from this study,
shows a daytime convective boundary layer, shallow nocturnal surface layers in the
morning and the evening, and a residual layer above the nocturnal surface layers.
The ceilometer detects the overall boundary layer height (blue triangles) whose
height is partly modified by large-scale sinking motion in the anticyclone domi-
nating the weather during the measurement period. Stable nocturnal surface layers


Search WWH ::

Custom Search