Geoscience Reference
In-Depth Information
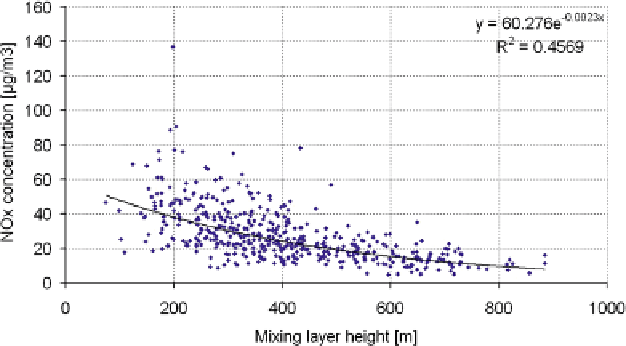
Fig. 4.7
Negative correlation between SODAR-derived mixing layer height and NO
x
concentra-
tions measured at an urban background station. From Schäfer et al. (
2006a
)
to low winds or due to vanishing horizontal concentration gradients. Schäfer et al.
(
2006a
) give examples of such correlations between MLH, derived from SODAR
measurements, and NO
x
-concentrations and aerosol concentrations observed at an
urban background station. Figure
4.7
shows the considerable negative correlation
between MLH and NO
x
-concentrations. An increase in the mixing layer height by a
factor of four from 200 to 800 m leads to a reduction of the NO
x
concentration by a
likewise factor of four from 40 to 10
g/m
3
. Thus, in this data range, the correlation
between pollutant concentration and mixing layer height can be perfectly described
by a hyperbola.
If the above preconditions apply, the simultaneous measurements of pollutant or
trace gas concentrations and MLH could be used to infer the emission rate of these
substances. For a given constant MLH and perfect vertical mixing, the concentra-
tion should increase with a rate inversely proportional to MLH. Such pollutant or
trace gas emission rates are then representative for areas of the order of 100 km
2
,
if MLH is horizontally homogeneous over this area, if horizontal winds are of the
order of a few m/s, and if vertical mixing takes place within about one hour. This
budget or mass balance method for emission determination (see Denmead
2008
for
an overview of emission determination techniques) is especially suited for the anal-
ysis of emission rates of diffusely emitted substances where it is difficult to localize
specific emission sites. An example for the derivation of the regional emission rate
of methane from a rural area from MLH, derived from SODAR measurements, and
near-surface nocturnal methane concentration increases is shown in Emeis (
2008
).
Figure
4.8
is taken from this study showing a time series of the near-surface methane
concentration (path-averaged values from FTIR measurements over several hun-
dreds of metres), a simultaneous time series of MLH from SODAR measurements,
and the deduced nocturnal emission rates (indicated by the hyperbolae in the lower
frame of Fig.
4.8
) from the nocturnal methane concentration increases. This is the
μ
Search WWH ::

Custom Search