Information Technology Reference
In-Depth Information
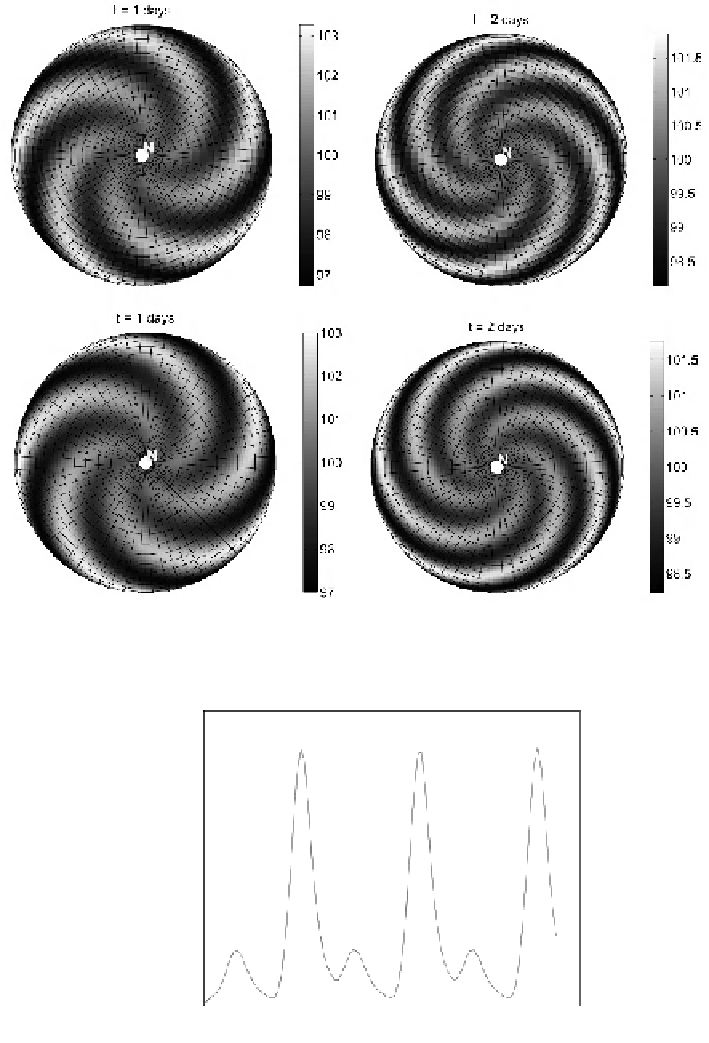
Fig. 9.
Experiment 3: numerical solutions at the first two days, grid
4
◦
×
4
◦
(top row) and
2
◦
×
2
◦
(bottom row)
0.025
0.02
0.015
0.01
0.005
0
0
2
4
6
8
10
Time
Fig. 10.
Experiment 3: graph of the relative error in time
sin
γt
. In Fig. 9 we also plot the numerical solutions obtained on two finer grids,
4
◦
×
4
◦
and
2
◦
×
2
◦
, at the first two days. It is seen that the finer the grid, the more accurate the


Search WWH ::

Custom Search