Information Technology Reference
In-Depth Information
56.5255
56.5254
56.5253
56.5252
56.5251
56.525
56.5249
56.5248
56.5247
56.5246
56.5245
0
2
4
6
8
10
Time
Fig. 4.
Experiment 1: graph of the
L
2
-norm of the solution in time
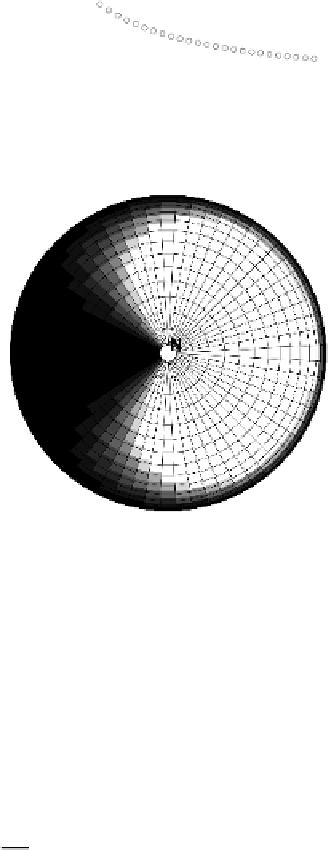
Fig. 5.
Experiment 2: the profile of the diffusion factor
μ
(North pole view). The colour map
ranges from white (maximum) to black (minimum).
where
ξ ≡ ω
(
λ − ϑ
1
tan
κ
1
ϕ
)+
ϑ
2
tan
κ
2
ϕ
sin
γt .
(33)
In order for (32) to be the solution to (1), the sources must be
α
∂T
∂λ
2
μT
α−
1
R
cos
ϕ
+
T
∂
2
T
∂λ
2
∂T
∂t
−
1
R
cos
ϕ
f
(
λ, ϕ, t
)=
2
T
∂
2
T
+
α
∂T
∂ϕ
+
cos
ϕ
R
∂ϕ
2
−
tan
ϕ
∂T
,
(34)
∂ϕ


Search WWH ::

Custom Search