Information Technology Reference
In-Depth Information
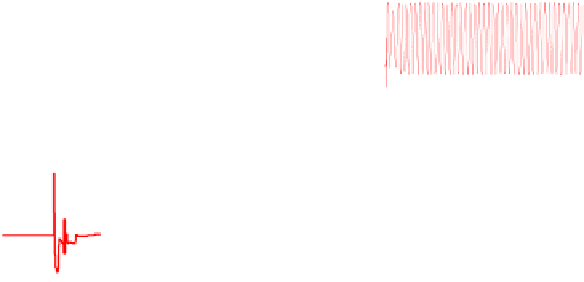
Figure 16 depicts the rotor d-axis current, rotor q-axis current, the rotor current and
the crowbar protection. The rotor current reached 2pu during the fault which initiated
the operation of the crowbar protection so as to prevent damage to the converter.
The response of the wind farm to different fault locations was examined. To get an
insight into this scenario, a three phase fault of 200ms duration was created at
different locations on the 50km, 20kV line. The result is shown in Fig. 17. From the
result, the impact of fault at different locations has almost the same impact on the
response of the wind farm. However, the impact is visibly different at the PCC.
The closer the fault location to the PCC, the more the dip in voltage and the more the
deviation from the nominal grid frequency.
0.8
1.35
0.6
1.30
0.4
1.25
0.2
1.20
0
1.15
0
1
2
3
4
5
0
1
2
3
4
5
(b) Time (s)
(
a
) Time (
s
)
1.0
6
0.8
0.6
4
0.4
2
0.2
0
0
0
1
2
3
4
5
0
1
2
3
4
5
(c) Time (s)
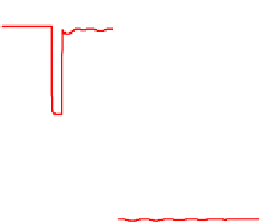
Fig. 15.
Response of the Wind farm (a) speed (b) PCC voltage (c) pitch controller (d) Electrical
torque when a three phase fault of 200ms duration is created at 1s at the middle of 100 km,
400kV line
(d) Time (s)
2
1
1
0
0
-1
-1
0
1
2
3
4
5
0
1
2
3
4
5
(a) Time (s)
(b)
T
ime (s)
2.5
1.0
2.0
1.5
0.5
1.0
0.5
0
0
0
1
2
3
4
5
0
1
2
3
4
5
(d) Time (s)
Fig. 16.
(a) The rotor d-axis current (b) rotor q-axis current (c) the rotor current (d) the crowbar
protection when a three phase fault of 200ms duration is created at 1s at the middle of 100 km,
400kV line
(c) Time (s)


Search WWH ::

Custom Search