Game Development Reference
In-Depth Information
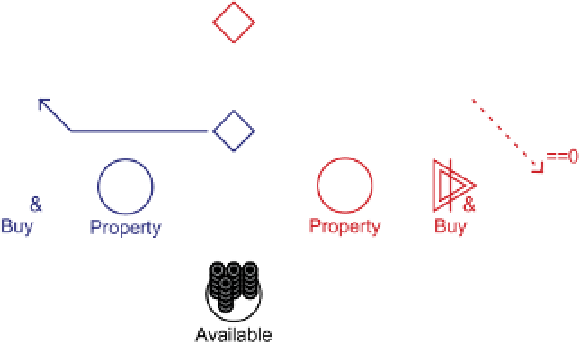
FIGURe 8.7
a deterministic version
of
Monopoly
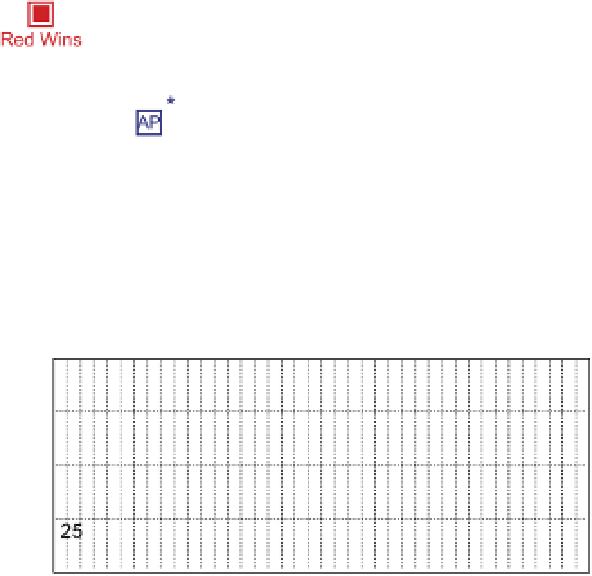
You can see the result of simulated play session in
Figure 8.8
. The trend is very clear
in this chart. (Note that in this chart the two players completely overlap because they
are following identical strategies, so only one player is visible.) Also note that in this
chart the number of properties owned by each player is represented as a thin line.
FIGURe 8.8
a simulated play ses-
sion of deterministic
Monopoly
The effects of luck
To study the effects of luck on the game of
Monopoly
, we then changed the script of
the red player to read as follows:
if((steps % 20 < 1) && (Money > 4 + steps * 0.02)) ire(Buy)
This leads to a situation in which the red player has only half as many opportunities
to buy a new property. Instead of buying every 10 steps, red buys only every 20 steps.
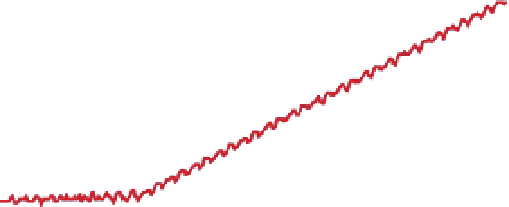
Figure 8.9
displays a chart that reflects these changes. If you look only at the money
lines, the players' fortunes don't seem that different initially. However, as any expe-
rienced player of
Monopoly
will tell you, the game is all about getting the properties.
The difference in properties held is the real indication of the players' strengths.