Game Development Reference
In-Depth Information
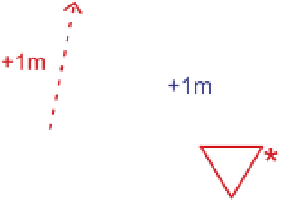
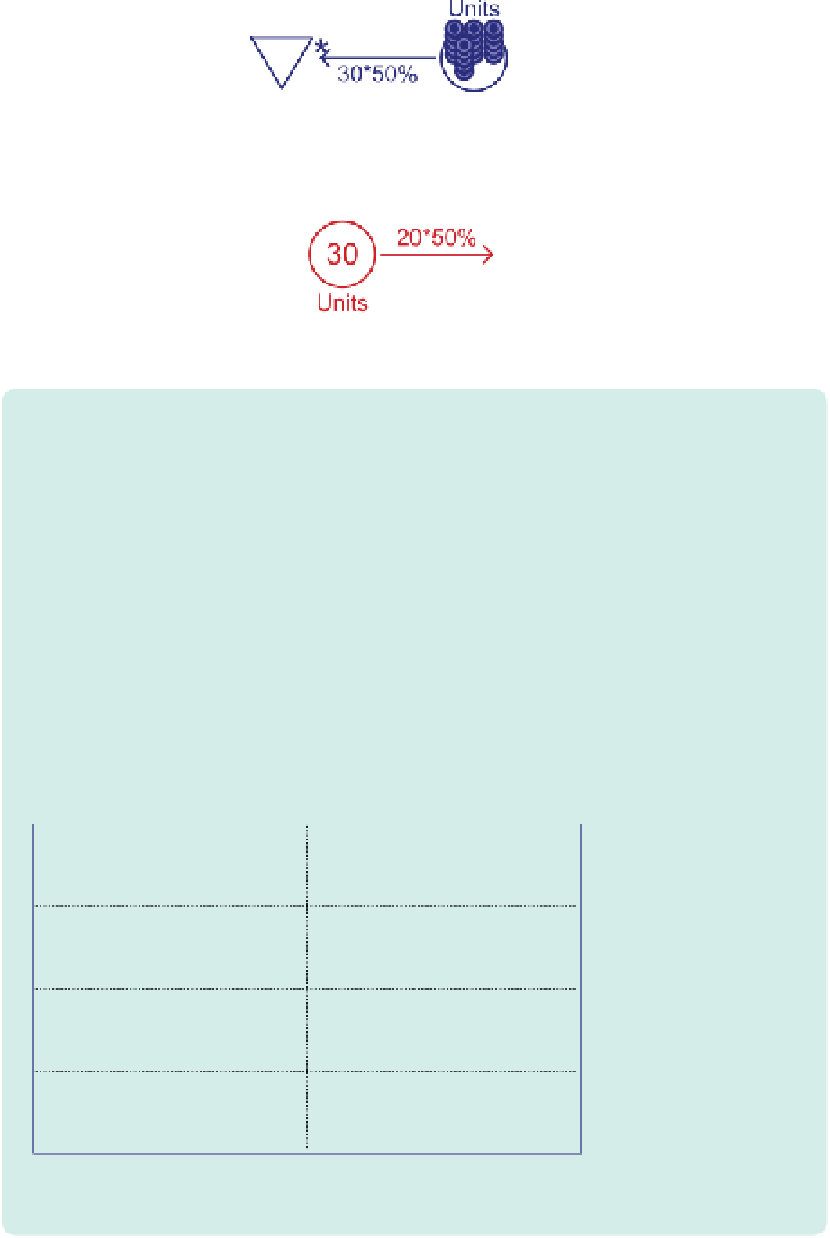
FIGURe 6.48
Basic combat in a real-
time strategy game
playinG around With numbers
You should take some time to play around in the machinations Tool with simple construc-
tions like the fighting mechanism of Figure 6.48. it trains your understanding of dynamic
systems. For example, can you predict whether blue's chances of winning increase when
each side's chance to destroy an enemy each time step is lowered to 10% per unit? Or
if blue's chances increase if there are fewer units on each side, even if their relative
strength is the same?
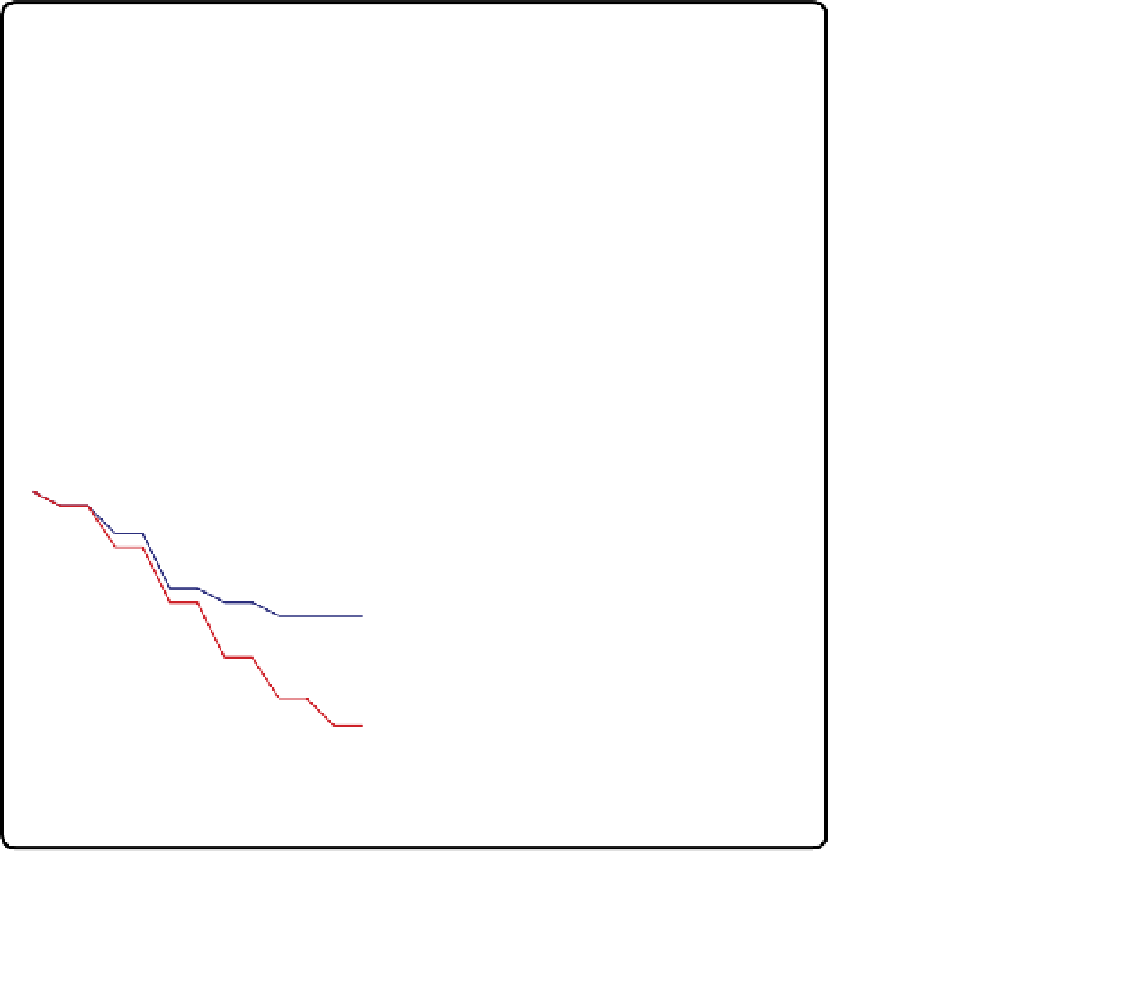
Figure 6.49
was produced from a run with both sides starting with 20 units and a 10%
chance of destroying an enemy. studying this chart reveals a widening gap between
the red and blue units starting roughly halfway through. By now, you should be able to
attribute this shape to a positive feedback loop kicking in after blue takes a decisive lead
in the battle. in some runs of this diagram, the feedback takes effect immediately leaving
the winner with many units; in other runs, the feedback never matters much, and the two
sides stay close until the very end, leaving the winner with only a few units.
FIGURe 6.49
a chart mapping the battle between 20 red and blue units