Game Development Reference
In-Depth Information
game.
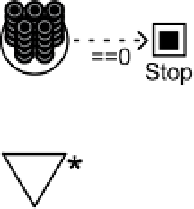
Figure 5.23
shows a couple of examples. The diagram on the left stops after
the 25 resources are drained automatically. In the example on the right, you win by
growing more than three apples
and
oranges.
FIGURe 5.23
end conditions
Let's see how you can use Machinations diagrams to simulate the mechanics of a
simple game—the arcade classic
Pac-Man
. We'll break down the process of modeling
Pac-Man
into six steps and add them to a Machinations diagram, one at a time to
show how they work. First we'll identify the game's most important resources, and
then we'll model the individual mechanisms. We'll give each major mechanism its
own color for ease of identification. The last of these mechanisms ties everything
together into a full diagram for
Pac-Man
.
We have to warn you that our model is an approximation, not a literal simulation
of what
Pac-Man
's software does. For example, we implemented a system in which
the ghosts come out of the ghost house at a regular rate, one every five time steps.
The real game uses a more complex algorithm to determine when they come out.
We could have modeled it, but it would have made the diagram too complex. Our
goal here is to teach you to use the Machinations framework, not to create an exact
copy of the real game, so we have simplified it a bit.
Resources
We will use the following resources to model
Pac-Man
:
n
Dots.
Scattered along the maze are the dots that Pac-Man must eat to complete a
level. Dots are tangible resources in
Pac-Man
that must all be destroyed to win. The
game starts with a fixed number of dots. Dots are not produced during play (except
when going to the next level).