Environmental Engineering Reference
In-Depth Information
(b)
1000
(a)
100
1200
1000
10
800
600
0.10
400
200
0
0.1
0
1
2
3
4
5
6
10
100
1000
Total phosphorus mg/m
3
Percent wetland
(c)
30
25
20
15
Ambient CO
2
/reduced precipitation
Elevated CO
2
/reduced precipitation
Ambient CO
2
/ambient precipitation
Elevated CO
2
/ambient precipitation
10
5
0
500
1000
1500
2000
-5
Light availability (
µ
mol m
-2
s
-1
)
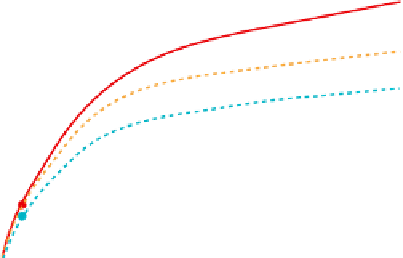
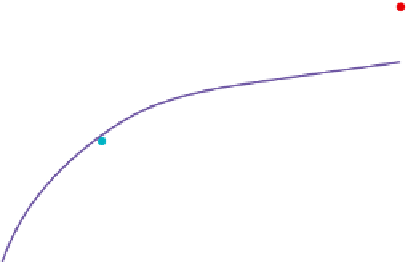
FIGURE 11.6
Examples of different kinds of functional relationships between controlling variables and eco-
system characteristics. (a) Linear relationship between the percentage of a stream's watershed occupied by wet-
lands and the concentration of methyl mercury (MeHg) in stream water. (From Weathers et al. unpublished.)
(b) Linear relationship between the log of the total phosphorus concentration and the log of the chlorophyll-a
concentration in lakes. (From
Dillon and Rigler 1974
.) (c) Decelerating relationship illustrated by the rate of photo-
synthesis in lupine as a function of light availability for plants grown under varying regimes of carbon dioxide
and water availability in a Minnesota grassland experiment. Treatments were applied at BioCON, a free air
carbon dioxide enrichment (FACE) study at Cedar Creek Ecosystem Science Reserve. (From Lee et al. unpublished.)
(d) Accelerating relationship between the distance to the windward edge of the forest and throughfall from fog
(fog water coming through the canopy to the forest floor) showing an exponential increase in the amount of water
from fog that reaches the forest floor from leeward to windward forest edge. (From
Ewing et al. 2009.
) (e) Hump-
shaped relationship between species richness and latitude showing maximum species richness in equatorial
regions. (From
Gaston 2000.
) (f) Threshold change in lake stability (a lake's resistance to mixing) following
Tropical Storm Irene: percent change in stability (% change from before the storm to minimum value in the week
following the storm) compared to proportion of the lake volume potentially replaced (the ratio of the water that
fell on the catchment plus the lake relative to the volume of the lake) for nine lakes and reservoirs in northeastern
North America. (From Klug et al. unpublished.) (g) Hysteretic relationship between the phosphorus concentration in
Lake Veluwe (Netherlands) and turbidity (measured as the inverse of the Secchi depth, a measure of transpar-
ency) over a period that included eutrophication and then restoration. (From
Ibelings et al. 2007
.)