Environmental Engineering Reference
In-Depth Information
BOX 8.3
RESEARCH TOOLS: CHRONOSEQUENCES
AND PHOSPHORUS POOLS
Soil P content and bioavailability is influ-
enced by the soil-forming factors of parent
material, climate, topography, time, and
biota (see Chapter 11;
Jenny 1941
).
Walker
and Syers (1976)
presented a model for the
changes in soil P pools over time during soil
development (
Figure 8.7
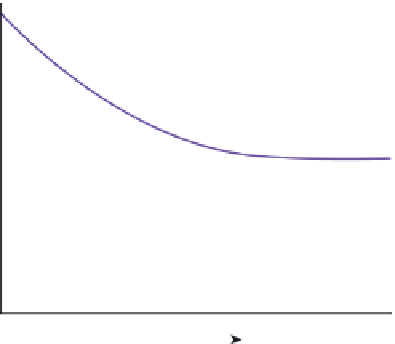
). This figure shows
that at the start of soil development, primary
mineral P (apatite) is the dominant soil P
pool. Phosphate released through apatite
weathering is relatively bioavailable. Over
time, total and bioavailable soil P decrease
due to inorganic P leaching and mineralogi-
cal changes that increasingly bind P into less
available, or even occluded, pools.
Ecosystem processes that occur on time-
scales of hundreds to thousands of years
can be difficult to study. Chronosequences
can be used to develop and test the Walker
and Syers model of soil development. A
chronosequence is a set of separate physical
sites that vary in age or time since distur-
bance. The challenge is to find locations
that are similar in all soil-forming factors
besides age, such as climate, parent material,
and topography.
The Hawaiian Islands have been used
effectively for chronosequence studies of
many different ecosystem processes. This
volcanic chain of islands is formed by the
slow movement of the ocean floor over a
deep source of volcanic lava. Islands build
up over “hot spots” of lava. As they shift
away from these “hot spots” they begin to
age without inputs of new lava flows. The
islands range in age from a few hundred to
more than 4 million years. Through careful
site selection, a chronosequence of sites can
be selected that have similar parent mate-
rial, climate, topography, and vegetation.
Walker and Syers synthesized results
from several chronosequence studies ranging
in age from 10,000 to 130,000 years to
developtheirmodelofsoilPfractiondevel-
opment over time.
Crews et al. (1995)
used
the Hawaiian Islands as a chronosequence
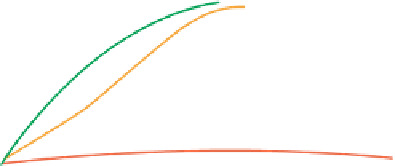
FIGURE 8.7
Shifts in P pools and total
quantity of P throughout the course of soil
development. (Based on
Walker and Syers
1976
and adapted by
Vitousek et al. 2010.)
Primary
mineral P
Occluded P
Soil organic P
Plant P
Time