Environmental Engineering Reference
In-Depth Information
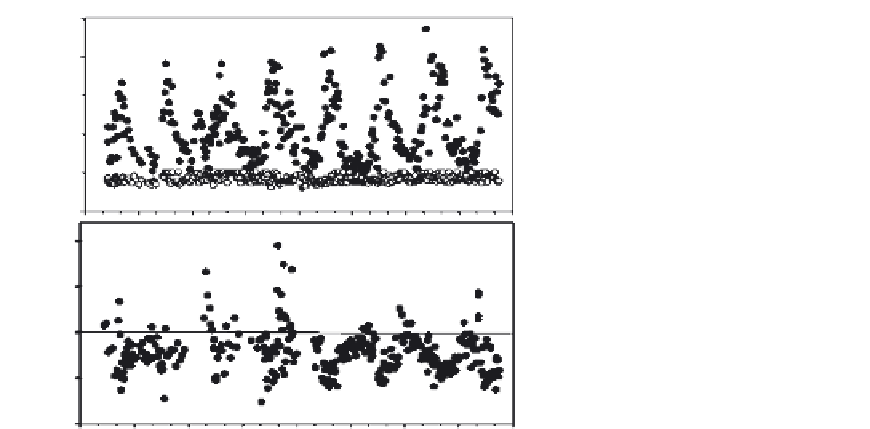
FIGURE 6.6
An eight-year record of
the partial pressures in the tidal, freshwa-
ter Hudson River. Upper panel: CO
2
in
the water (closed symbols) and air (open
symbols); lower panel: O
2
in the water;
the solid line pO
2
5
2500
2000
1500
0.2 represents O
2
in
air. (Modified from
Raymond et al. 1997 and
Cole and Caraco 2001
.)
1000
500
0
0.30
0.25
0.20
0.15
0.10
92
93
94
95
96
97
98
99
00
Date
strongly net heterotrophic; GPP
R, and a large fraction of R
h
is supported by external
inputs. The river exports less organic C than it imports.
In this river, as with most rivers, heterotrophic organisms are subsidized by organic C
inputs from the watershed. GPP produces O
2
and consumes CO
2
; R does the reverse.
Because GPP
,
R, the Hudson and most large rivers tend to be supersaturated in CO
2
and
undersaturated in O
2
with respect to the atmosphere (
Cole and Caraco 2001; Cole et al.
2007
;
Figure 6.6
). Since gases equilibrate according to their partial pressures in air and
water, these systems are net sources of CO
2
to the atmosphere and net sinks for atmo-
spheric O
2
. The Hudson has some area of anoxic sediments and is also a source of CH
4
to
the atmosphere (about 2 g C m
2
2
y
2
1
;
de Angelis and Scranton 1993
).
An interesting feature of the Hudson C budget is how much it changed in response to
the zebra mussel over just 20 years. Many rivers, including the Hudson, are turbid and
well mixed. This means that the phytoplankton spend a lot of time in water with too little
light for photosynthesis. Their physiologic balance can easily be tipped because they
already respire a great deal of their own photosynthesis, more so than in well-lit environ-
ments (
Cole et al. 1992
). Thus, even a modest increase in grazing pressure from zebra
mussels caused the phytoplankton to crash (
Caraco et al. 1997, 2006
). The zebra mussel
effect was also far from modest. Prior to that invasion, the water column of the Hudson
was filtered by organisms about once every 50 days. Following the invasion the zebra
mussel alone filtered the water about once every 2 to 3 days depending on the location
and year. The biomass of the phytoplankton decreased by about 80% with the onset of the
zebra mussel (
Caraco et al. 1997; Strayer et al. 1999
). The Hudson example illustrates the
,