Environmental Engineering Reference
In-Depth Information
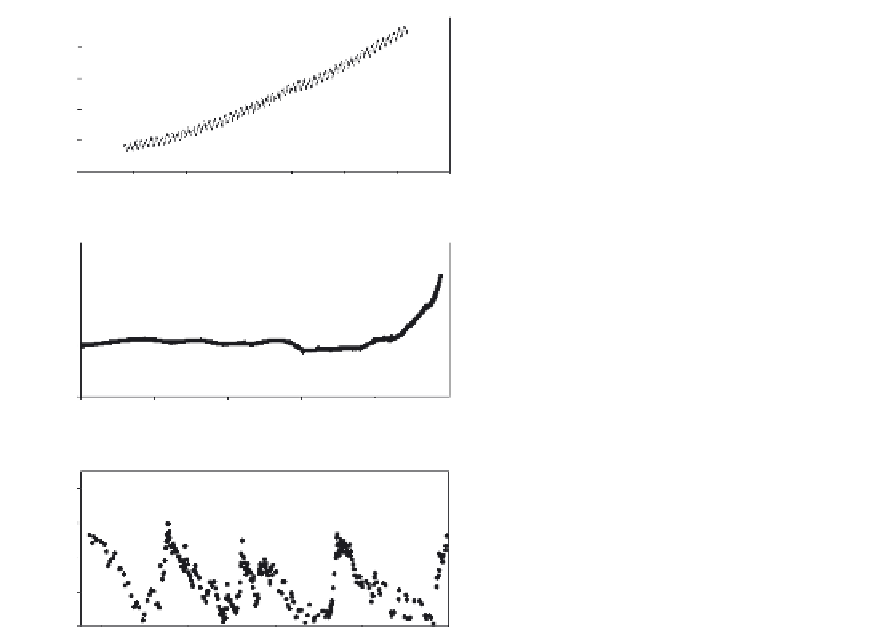
FIGURE 6.2
Variation in atmospheric CO
2
over three timescales. Panel (a) shows direct mea-
surements of atmospheric CO
2
at Mauna Loa,
Hawaii. The data for panels (b) and (c) come from
ice cores for (b) the Law Dome ice core in
Antarctica and (c) the Vostok ice core in
Antarctica. The x-axis for panel (c) is in years
before present; for panels (a) and (b) the x-axis is
the calendar year. ((a) is drawn from data available
at Dr. Pieter Tans, NOAA/ESRL (
www.esrl.noaa.gov/
gmd/ccgg/trends/
)
and Dr. Ralph Keeling, Scripps
Institution of Oceanography (
scrippsco2.ucsd.edu/
)
;
(b) is drawn from data available at
http://cdiac.ornl.
gov/trends/co2/lawdome.html
(
Etheridge et al. 1996
);
and (c) is drawn from data available at
http://www.
html
(
Petit et al. 1999
).)
400
(a)
380
360
340
320
300
1950
1960
1970
1980
1990
2000
2010
2020
Calendar year
360
(b)
320
280
240
1000
1200
1970
1600
1800
2000
Calendar year
(c)
340
300
260
220
180
-400,000
-300,000
-200,000
-100,000
0
Years before present
mostly the combustion of fossil fuel. There are several lines of evidence that, together,
underscore this fact; two are described as follows (see IPCC for further reading at
http://
1. Global mass balance. In
Table 6.2
we show the major inputs and output of CO
2
to and
from the atmosphere for the decade of 1990 to 2000. We chose this decade because the
numbers were published in a peer-reviewed journal (
Schimel et al. 2001
) and have been
well vetted. Newer sources list larger anthropogenic inputs (
Field and Raupach 2004
),
but the basic story has not changed. In
Table 6.2
we see that the combustion of fossil
fuel puts about 5.5 Pg of C/y as CO
2
into the atmosphere, with an additional
1Pg
of C/y from land-use changes (basically the cutting of forests, mostly in the tropics;
Dixon et al. 1994
). This 6.5 Pg C/y anthropogenic source is larger than the observed
rate of increase in the atmosphere (3.1 Pg C/y), so there is more than enough
anthropogenic CO
2
to account for the atmospheric increase. The difference between
CO
2
emissions and the gain in storage in the atmosphere represents C that is either
B