Travel Reference
In-Depth Information
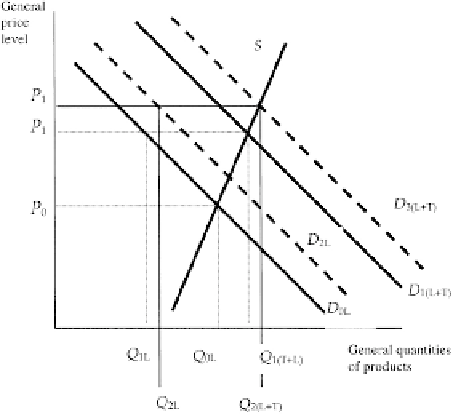
Figure 3.1
Infl ation and tourism
Notes: S, supply curve; D0L, local demand (before tourist expenditure enters the economy);
D
1(L
+
T),
local and tourist demand after tourist expenditure enters the economy (primary or direct effect);
D
2L
, increased local demand due to increased employment and income (secondary effect);
D
3(L
+
T),
local and tourist demand after the secondary effect took place;
P
, general price level;
Q
, general
quantities of products.
whose income remains unchanged, are only able to buy quantities along the
curve
D
0L
in a new equilibrium at higher prices, they may only buy a lower
quantity
Q
2L
. Furthermore, because tourism demand increases production,
local employment and salaries will rise (a secondary effect). Some of the
additional salaries will shift the local demand curve to the right
(D
2L
)
as
locals are now willing/able to spend more money for the available goods and
services. At the same time, the total demand curve
D
1(L+T)
will move to
D
3(L+T)
and push prices up further. It is the slope of the supply curve that
decides how much additional local purchasing power will be absorbed by the
higher prices.
Where a country has more purchasing funds than commodity funds,
international tourism will increase the inflation rate; in the opposite case, in
an economy with deflationary tendency it will stabilise prices. Conversely,
outgoing tourism acts as reducer of purchasing power in an outgoing econ-
omy - theoretically, it may reduce the inflation rate or cause deflation.
After the arrival of visitors, the increased demand in the destination
country will lead to trading with a larger quantity of products at higher
prices. The residents are worse off as they will receive a smaller quantity of
products at higher prices (a primary inflation effect). Since the additional
tourist demand triggers additional production, the employment rate and
wages of the residents increase. These wage increases enhance the residents'
Search WWH ::

Custom Search