Biology Reference
In-Depth Information
Grids should be scrupulously cleaned with acetone before picking up the replicas to
ensure firm attachment of the replica to the grid.
21.3.7
Analysis of metal replicas by TEM
Replicas mounted on EM grids are examined using a TEM. Replicas are of intrinsi-
cally high contrast and observation is undertaken with a moderate beam current at an
accelerating voltage of 80 kV. The resolution of the replica is limited by the dimen-
sions of the metal grains being typically 1.5-2 nm for a platinum-carbon replica.
Grids are examined first at low magnification (around 1 K) to inspect the quality
of the replica. High-quality replicas have a fine granular aspect and show no signs
of doubling. Areas with replicated cells can first be identified at low magnification
(around 1 K) by a bulge (caused by the nuclear area of the original cell) sticking out
of the plane of the replica. Augmenting magnification to around 5 K will show a sur-
rounding area that is slightly elevated relative to the scaffold area and that is also part
of the cell body. For T lymphocytes, this area is more prominent in previously ac-
tivated cells as compared to naive cells. If the cells have been labeled before adher-
ence to the mica sheet, the border of this area should coincide with a transition from a
gold-labeled to an unlabeled surface. Direct counting of gold particles can be done in
the EM at a magnification of 25-30 K. If the microscope is equipped with a camera
that has a tiling function, it is more convenient to take overlapping images of the cell
at 8-12 K magnification (depending on the size of colloidal gold conjugate used, the
cell body size, the resolution of the camera, and the maximum number of overlapping
images that the camera and associated software can handle) and generate a composite
image of the whole cell body that can be analyzed off-line (
Fig. 21.6
).
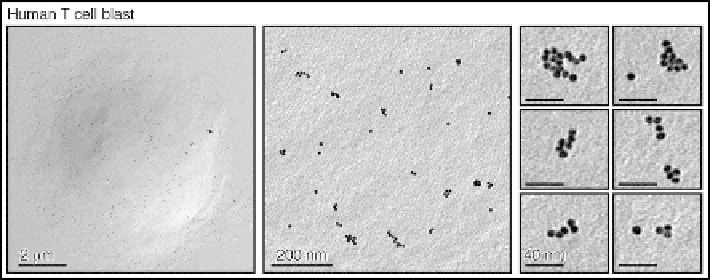
FIGURE 21.6
Analysis of cell surface replicas by transmission electron microscopy. Cell surface replicas of
human T-cell blasts after anti-TCR-immunogold labeling are shown. Note the prominent
bulge representing the nuclear area-covering membrane and the flatter area surrounding it.
The cell overview picture (left panel) was generated from nine partially overlapping photos
taken at 12 K magnification, and enlargements are shown in the middle and right panels.