Biology Reference
In-Depth Information
sparsely expressed in cell plasma membranes.
Figure 20.5
B shows the distribution of
fluorescence intensities of individual ACP-TM spots.
20.3.2
Determination of receptor dimer lifetimes in single-color
experiments
This section describes the method for determining receptor dimer lifetimes in cell
plasma membranes by observing the colocalization of individual fluorescent spots.
Figure 20.6
A and B shows a typical video sequence and trajectories, respectively,
indicating that virtually all CD59 molecules tagged with Cy3-Fab undergo diffusion
and frequent colocalization and codiffusion events often lasting longer than inciden-
tal approaches. Separation into monomers follows these events. Similar to CD59,
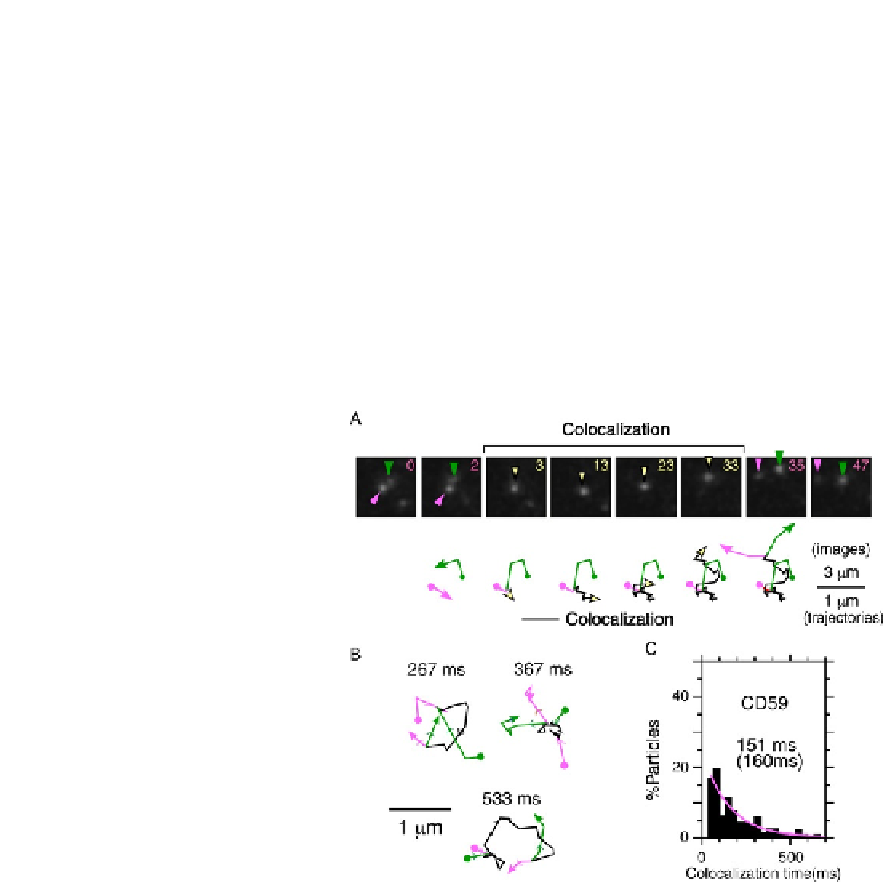
FIGURE 20.6
Transient homo-colocalization of CD59 in steady-state cells. (A) Representative single-
molecule fluorescent image sequence of two diffusing CD59 molecules (Cy3-Fab-labeled
CD59, arrowheads) undergoing transient colocalization and codiffusion. The number in the
upper-right corner in each image indicates the number of frames (recorded at video rate).
Trajectories are shown on a threefold magnified scale: black trajectory designates molecules
during colocalization. (B) Trajectories of two Cy3-Fab-labeled CD59 spots that exhibited
transient colocalization and codiffusion. Periods of colocalization (black) are indicated in
milliseconds. (C) The histogram shows the distribution of colocalization duration of two CD59
fluorescent spots. It was generated by measuring the duration of each colocalization event
and fitted with an exponential function. The decay time and the lifetime corrected with
the photobleaching lifetime are shown in the box.