Biology Reference
In-Depth Information
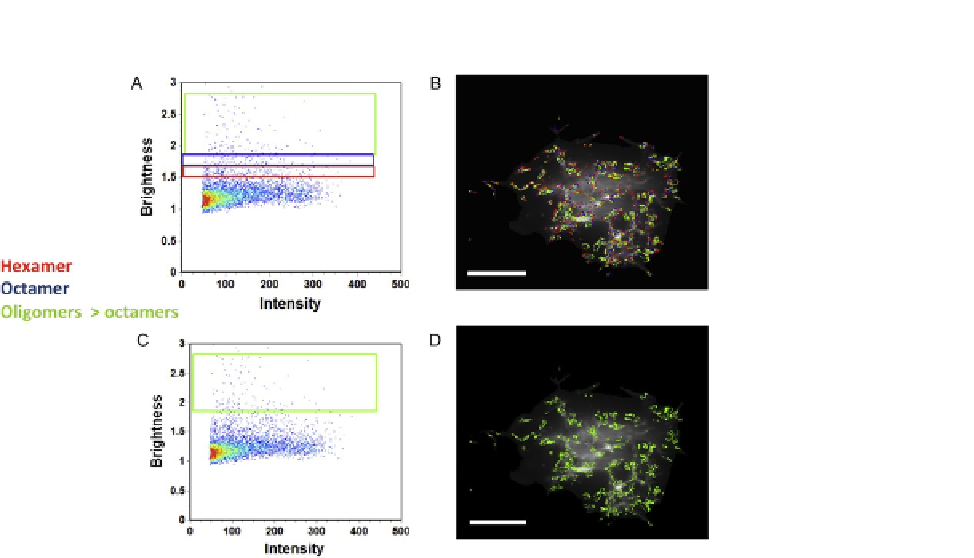
FIGURE 19.2
Brightness versus intensity analysis of EGFP-VP40 in HEK293 cells displaying oligomers.
(A) Brightness versus intensity plot of the HEK293 cell shown in
Fig. 19.1
highlighting
hexamers (red box), octamers (blue box), and oligomers larger than octamers (green box).
(B) Brightness distribution of VP40 with selected pixels from A displaying hexamer (red),
octamers (blue), and oligomers larger than octamers (green). Oligomeric VP40 structures are
enriched on the PM and filaments protruding from the cell PM. (C) Brightness versus
intensity plot of the HEK293 cell shown in Fig. 19.1 highlighting oligomers larger than octamers
(green box). (D) Brightness distribution of VP40 with selected pixels fromC displaying oligomers
larger than octamers (green). Scale bar¼18 mm.
This research was originally published in
Adu-Gyamfi et al. (2013)
.
19.2
CONSIDERATIONS
Cells and organelles are dynamic molecules and move during the scanning periods.
To counter this issue, RICS analysis was performed with a moving average of ten
frames in the SimFCS software. This method can account for motions of cells or
organelles that are on the timescale of 10 s or longer. Fluorophores can bleach
and although RICS analysis is independent of bleaching (because the correlation
is determined in each frame), bleaching in N&B analysis can lead to problematic data
even with changes as small as 10% of the average intensity. Bleaching was verified
for each experiment and did not exceed 5% of the original intensity in analyzed