Biology Reference
In-Depth Information
Application of FRET and Microscopy
FRET analysis
11.
Ratios of excitation strengths
r
ex,1
and
r
ex,2
are calculated for both excitations.
These ratios require reference as well as normalized characteristic spectra (see
Eq.
(14.6)
) and provide a link between absorption coefficients and receptor
concentrations.
12.
Nonnegative unmixing on the basis of
F
i
,ref
(l) and
F
i
,ref
(l) and all
additional contributions was done for both excitations to obtain the excitation
wavelength-specific donor and acceptor contributions d
i
and a
i
for each
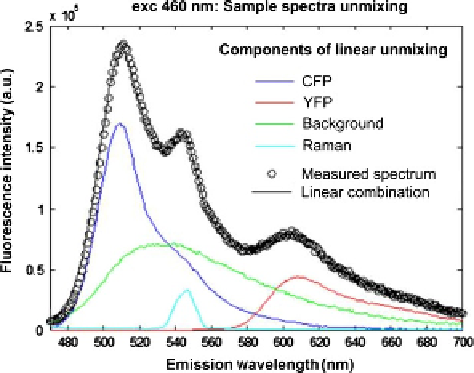
pixel. An example of Fluorolog data unmixing is shown in (
Fig. 14.7
).
13.
With the relative donor and acceptor contributions d
i
and a
i
, FRET calculation
was performed according to Eqs.
(14.3)-(14.5)
. Values and images of
Ef
D
,
Ef
A
, and
x
D
are calculated for Fluorolog and imaging data, respectively. To
estimate the error of the quantities, channel intensity information was stored
together with the results for further processing. Therewith, weighted mean
values for
Ef
D
,
Ef
A
, and
x
D
can be calculated.
14.
Selection of region of interest for FRET images is done mainly to distinguish
spatial regions or to further evaluate time traces for individual regions.
15.
Finally, data presentation is done according to specific biological interest. To
check for analysis artifacts, 2D histogram of all FRET parameters versus pixel
brightness was generated. FRET parameters should not depend on pixel
brightness. Further, from the regions of interest, selective parameters can be
evaluated.
FIGURE 14.7
Principle of spectral linear unmixing. The measured emission spectrum (460 nm excitation)
was fitted by a linear combination of reference spectra for YFP, CFP, Raman, and
background. The reference spectra were obtained separately.