Biology Reference
In-Depth Information
center of the screen. For FCS measurements in the cytosol, place the region of
interest marker near the center of the cell, just to one side of the nucleus
where the cell is likely to be tallest, and fill the observation volume in the axial
direction. Perform a pinhole adjustment in
X
and
Y
and note the settings.
c.
To establish the proper laser power setting, begin an FCS recording with low
intensity (0.1-1%). Note the extent of photobleaching that occurs during the
recording. Repeat the process on different cells testing different laser powers and
monitor the extent of photobleaching. Select the lowest laser power setting
that gives minimal photobleaching (no leftward shift in the autocorrelation curve)
but still gives a good signal from the fluorescent control sample and low
background fluorescence. Use this laser setting for all subsequent experiments.
d.
Perform an FCS recording (for 10
10 s intervals) in the cytosol of five
different cells, saving the data files after each run for subsequent analysis at a later
time. If the software allows, monitor the counts per molecule during the recording
to get an idea of the molecular brightness of the control sample.
e.
If the receptor of interest is a plasma membrane receptor, prepare a coverslip with
control cells expressing a known plasma membrane monomeric or dimeric
control such as CD-86 or CD-28, respectively. Quickly capture an image of the
cells (
Fig. 10.2
).
Choose a cell of low to medium brightness (count rate of 50-250 kHz), and adjust the
zoom setting to 3. Working quickly, use fast continuous scanning to position the cell
in the center of the screen and focus on the upper plasma membrane. Mark a region
on the upper plasma membrane (over the nucleus) and begin an FCS recording. Dur-
ing the first 10 s interval there will be a dramatic photobleaching of the nonmobile
fraction of receptors that will appear as a rapid decline in the count rate. During the
subsequent 10 s intervals, it will be necessary to adjust the focal plane of the sample
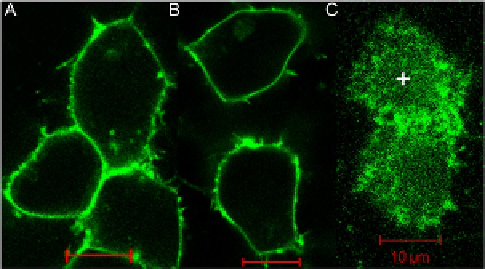
FIGURE 10.2
Confocal image of YFP-tagged receptors in the plasma membrane of HEK293 cells. (A) Beta-
adrenergic receptors; (B) CD-28 receptors; (C) upper plasma membrane of two transfected
cells with
þ
marking the region where an FCS recording was made. Scale bar
¼
10
m
m.