Database Reference
In-Depth Information
The report and the oral presentation should not be marked separately. It is sug-
gested that a provisional mark is first given to the work described in the report. This
mark is either confirmed or adjusted accordingly at the oral presentation.
3 Case Studies: The Good, the Bad and the Ugly
The project was first used in the author's data mining module in 2001. The project has
become an established part of the coursework ever since. The weight for the project in
the coursework has increased from a mere 40% at the beginning to 60% later and to
the current 100% in 2010. In 2007, the author created a data mining module at Sara-
jevo School of Science and Technology. The project was and still is a significant part
(60%) of the coursework for that module.
Between 2001 and 2005, the author mainly relied on data sets from the UCI Ma-
chine Learning Repository [11] and a few real-life data sets from his consultancy
work. Since then, data source was no longer a major concern. Before 2006, IBM In-
telligent Miner for Data was used as the data mining tool. Since 2006, Weka has been
used for its rich solutions, simplicity and availability for students. Microsoft Excel has
also been used for assisting data exploration and data pre-processing.
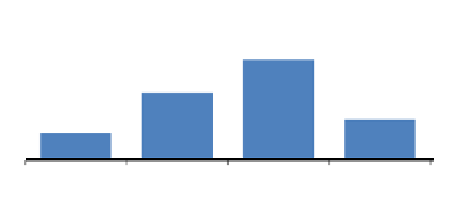
Figure 1 shows the distribution of the project works in the four categories for the
35 project groups collected between 2002 and 2010 for the purpose of this paper. It is
true that most of the classes are fairly small in size, and the biggest class size is 34
students (11 groups). Majority of project results fall into Fair and Good categories
while Unsatisfactory and Excellent projects are in the minority. This seemingly good
result reflects the practice that we mark on the project experience and what students
learn from it. This paper selects three typical projects from the 35 group projects as
case studies. The purpose is to show the nature of the tasks involved, student works
produced and assessment of their works.
15
10
6
4
Unsatisfactory
Fair
Good
Excellent
Fig. 1.
Distribution of Project Categories
3.1 Project One: The Bad
The Data Set
The data set for this project is about insurance purchases. It has 14,845 recordings
about purchased product type, regional code, profession, age, first rate paid, contract-
ing sum and closing date. Potentially interesting patterns include a classification
model regarding which type of product is purchased by what kinds of customers.