Graphics Reference
In-Depth Information
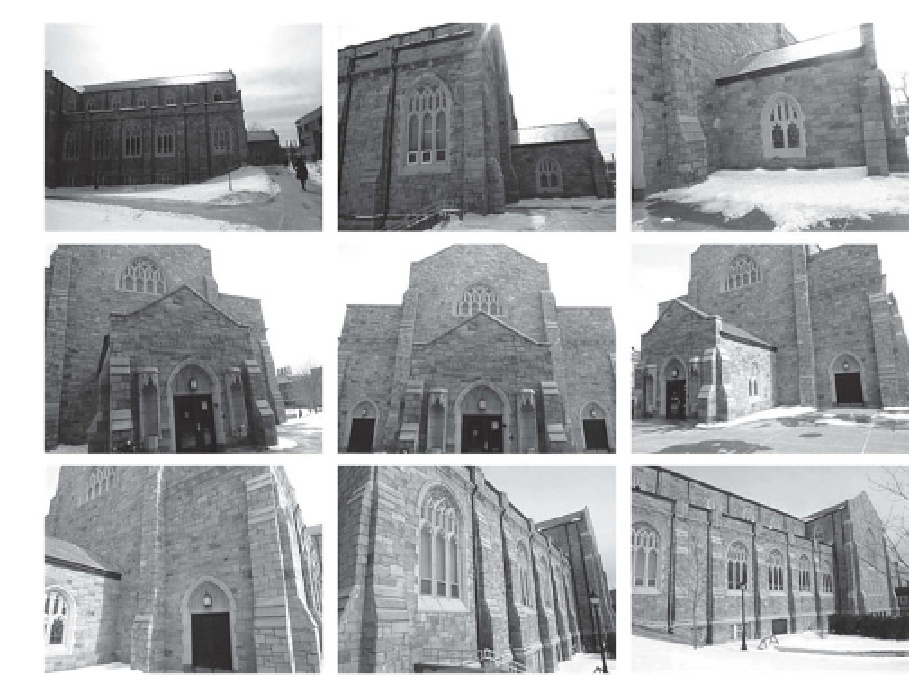
Figure 6.15.
Example images from a video sequence obtained using by moving a handheld
camera around a building.
To obtain the input for matchmoving, 19,780 unique features were automatically
detected and tracked over the course of the camera motion. Since the camera is
moving only slightly between frames, the tracker uses single-scale corners, which are
automatically checked to make sure the matches are consistent with the projections
of underlying 3D scene points. Figure
6.16
illustrates the presence of a randomsubset
of 200 of the features ineach frame; we can see that features constantly enter and leave
the camera field of view, and that no single feature lasts very long. On the average,
each feature track had a duration of 12 frames, and the maximum duration was 122
frames. An average of 616 tracked features appeared in each frame. Since Figure
6.16
corresponds to the sparsity pattern of the matrix
J
PX
in Equation (
6.68
), we can see
that in practice, the matrix
J
J
is much sparser than what Figure
6.14
b suggests.
Visualizing the estimated camera path with respect to the estimated 3D points is
critical for determining whether a matchmoving solution makes sense. Figure
6.17
illustrates a camera tracking result for the video sequence, in which the cameras
are represented as red dots and the scene points are represented as blue dots. Each
camera's principal axis is indicated by a red line. The camera track was obtained
using a combination of the projective reconstruction, metric reconstruction, and
sequential updating algorithms described in the previous sections. Even though the
reconstructed scene is only sparsely sampled (i.e., we only obtain 3D estimates of
points corresponding to tracked features), we get a strong sense of the environment
and can be confident that the camera positions are well estimated.