Agriculture Reference
In-Depth Information
9
8
7
6
5
4
2028
2013
1999
1987
15 years
1974
14 years
1959
3
2
1
0
12 years
1922
13 years
15 years
37 years
118 years
1804
1922
1959
1978
1987
1999
2013
2028
Year
Figure 1.2
World population increase.
agricultural production is adjusted according to popu-
lation increase (Figure 1.4), cereal production per capita
has increased by 17%, and fruit, vegetable, and oilseed
production per capita has increased by 28%, 62% and
16%, respectively, while production of root crops and
pulses has reduced per head of capita in the world.
These yield increases have been brought about by a
combination of higher soil fertility (mainly due to addi-
tions of inorganic nitrogen fertilizers), improved chem-
ical control of diseases and pests, better weed control
through improved agronomic practices and herbicides,
and better crop agronomic practices (e.g. correct plant
densities) as well as by growing genetically improved
cultivars.
So, how much of the improved yield can be attributed
to the plant breeder (i.e. genetic change) and how much
to better farming practices (i.e. environmental change)?
Yield increases of more than 100% have been found
between single cross maize cultivars over the traditional
homozygous varieties. Many researchers have attributed
this increase to the heterotic advantage of single crosses
over homozygous inbred lines, and therefore conclude
that the contribution of plant breeding must be very
high. However, a complication arises when comparing
single cross hybrids, where selection has been aimed
at maximum hybrid productivity, against inbred lines
which have been chosen for their combining ability
rather than their own performance
per se
.
It might be suggested that the question could only be
answered properly by growing a range of old and new
varieties under identical agricultural conditions. Since
most modern cultivars are dependent on high levels of
14
1955
2005
12
10
8
6
4
2
0
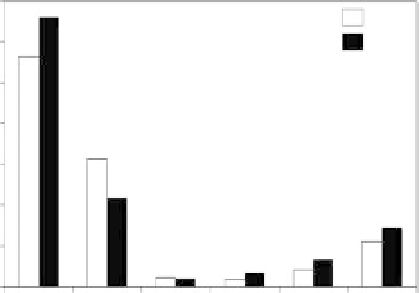
Cereals
Roots
Pulses
Oil crops
Vegetables
Fruit
Figure 1.3
Total world crop production 1955 and 2005.
350
1955
2005
300
250
200
150
100
50
0
Cereals Roots Pulses Oil crops Vegetables Fruit
Figure 1.4
Total world crop production per capita
1955 and 2005.