Agriculture Reference
In-Depth Information
Association between variates or years
The selection differential is the average phenotypic
superiority for the character in question of the selected
genotypes over the whole of the population from which
they were selected.
Consider the following example, the average seed
yield of an F
3
family is 15 kg. Suppose plants that pro-
duced the highest seed yields (with a mean
The degree of association between any two, or a number,
of different characters can be examined statistically by
the use of
correlation analysis
. As noted earlier, correla-
tion analysis is similar in many ways to simple regression
but in correlations both variables are expected to be sub-
ject to error variance, and there is no need to assign one
set of values to be the
dependant variable
while the other
is said to be the
independent variable
. Correlation coef-
ficients (
r
) are calculated from the equation (see in more
detail p. 76):
=
20 kg)
were selected and grown to the next generation. What
would be the selection differential? Since the selection
differential is the average performance of the selected
plants over the base population (i.e. all original unse-
lected plants in the family) as a whole,
S
=
20
−
15 or
5 kg seed yield.
Now, if the mean seed yield of the selected progeny
in the following year (F
4
) was found to be 17.5 kg,
what would be the response to selection? Since response
to selection is the difference between the mean of the
progeny and the mean of the parental generation before
the application of selection,
R
(
)
SP
x
,
y
=
√
[
r
(
)
×
(
)
]
SS
x
SS
y
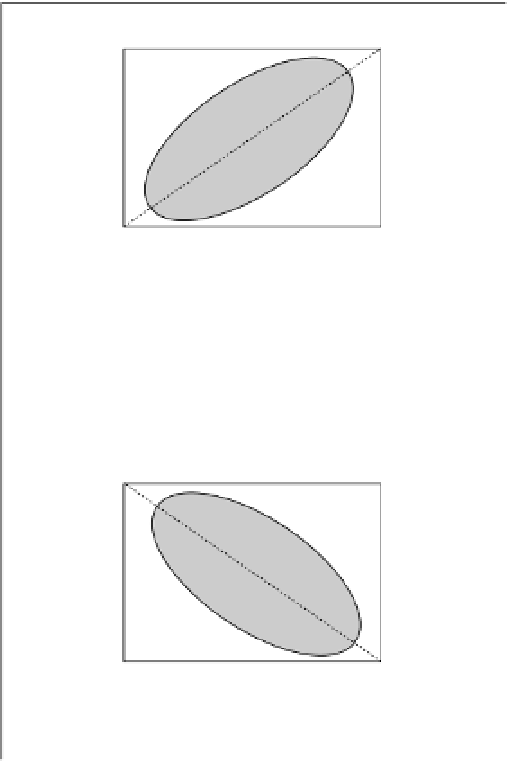
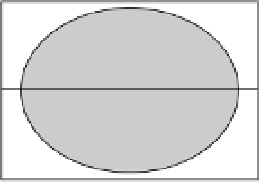
Diagrammatically, the association between two vari-
ables is shown in Figure 7.3 with positive correlation
(top), no correlation (middle) and negative correlation
(bottom).
=
17.5
−
15 or 2.5 kg
of seed yield.
Finally the narrow-sense heritability,
h
n
would be
given by:
Positive correlation
h
n
=
/
=
/
=
R
S
2.5
5.0
0.5
It should be noted that in the above example it is
assumed that there are no dramatic year effects. In a
practical situation, actual performance from year to year
is highly variable. This can be taken into account in
part by growing a
random sample
of progeny and con-
trols the next year. Assuming that the random sample
is indeed representative of the whole sample, it will be
possible to use this in order to adjust the values and to
obtain a direct indication of response to selection.
Similarly, a plant breeder is quite likely to want
to know what response might be expected from a
given selection differential when the narrow-sense her-
itability has already been estimated (from the parti-
tioning phenotypic variances or from offspring-parent
regression).
Therefore, if the selection differential (
S
) applied
was 5 kg of seed yield and the narrow-sense heritability
had been estimated to be 0.5, the response to selection
expected would be:
Zero correlation
Negative correlation
h
n
×
=
=
×
=
R
S
0.5
5.0
2.5
kg
Figure 7.3
Diagrammatic representation of positive
correlation (top), zero correlation (middle) and negative
correlation (bottom).
Thus the average seed yield of the selected progeny
might be expected to be 15
+
2.5 or 17.5 kg.