Digital Signal Processing Reference
In-Depth Information
White signal: m=4 and VA=9
8000
6000
4000
2000
0
-1
-0.5
0
0.5
1
w
/
p
White signal: m=4 and VA=9
10
5
10
0
10
-5
-1
-0.5
0
0.5
1
w
/
p
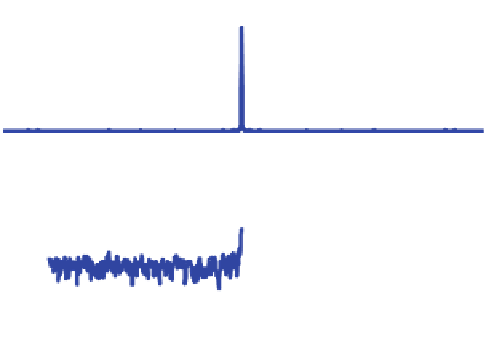
Fig. 7.38
White noise (PSDs) with a mean of
m ¼
4 and
s
2
¼
9
White signal: m=5 and VA=1
6
15000
10000
5000
0
-1
-0.5
0
w
0.5
1
/
p
White signal: m=5 and VA=1
6
10
5
10
0
10
-5
-1
-0.5
0
0.5
1
w
/
p
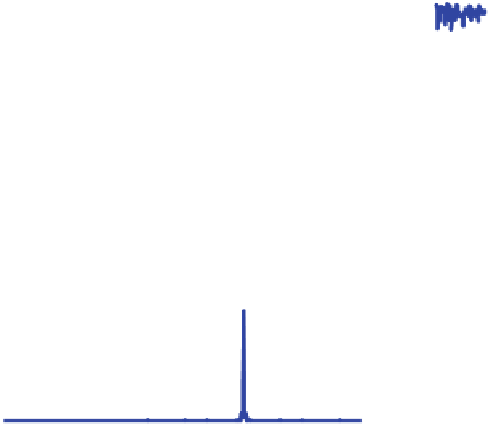
Fig. 7.39
White noise (PSDs) with a mean of
m ¼
5 and
s
2
¼
16
Exercise M.7.4
(MATLAB file
exercise_M_7_4.m
) Using the periodogram
method, estimate the PSD and show the PSD plots for sinusoidal signals with
A
1
¼
3,
f
1
¼
270 Hz as well as
A
2
¼
8,
f
2
¼
175 Hz in a normal white noise
with
m ¼
3 and
s
2
¼
25, as shown in Fig.
7.40
.


Search WWH ::

Custom Search