Digital Signal Processing Reference
In-Depth Information
Solution
Using (
7.30
) and (
6.77
), we write:
1
U
2
e
2
ljtj
e
jot
d
t;
S
XX
ðoÞ¼
1
2
4
3
5
;
ð
1
0
¼ U
2
e
ð
2
ljoÞt
d
t þ
e
ð
2
lþjoÞt
d
t
1
0
2
l
¼
2
U
2
þ o
2
:
ð
7
:
32
Þ
2
ð
2
lÞ
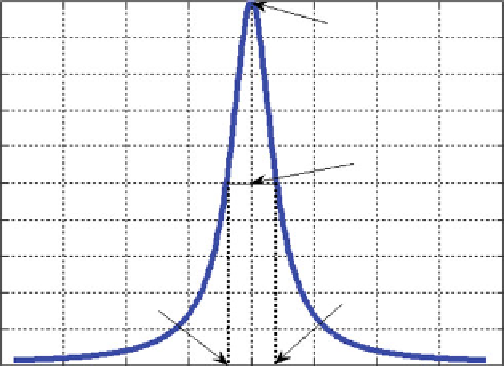
The spectral density is shown in Fig.
7.2
for
l ¼
1 and
U ¼
1.
As expected, one may note from Fig.
7.2
, that the spectrum band becomes wider
for higher values of
l
, i.e. average number of zero crossing in a unit of time.
7.1.4 Properties of PSD
The PSD has a number of useful properties. Some of them are presented below.
We will consider only a real process which is at least WS stationary.
1
U
2
/
l
0.9
0.8
0.7
0.6
U
2
/2
l
0.5
0.4
0.3
0.2
-
2
l
2
l
0.1
0
-
20
-
15
-
10
-
5
0
5
10
15
20
w
Fig. 7.2
Power spectral density (PSD) in Example 7.1.1

Search WWH ::

Custom Search