Digital Signal Processing Reference
In-Depth Information
PROBABILITY P1
0.8
0.6
P1
0.4
0.2
0
0
1
2
3
4
5
6
7
8
9
10
Range
PROBABILITY P1, P1=F(A)
1
P1
0.5
0
0
2
4
6
8
10
12
Range
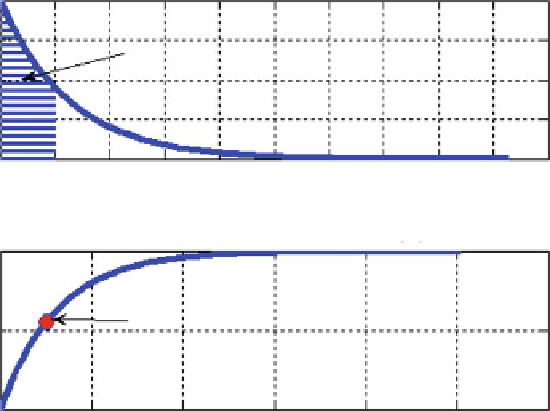
Fig. 5.46
Illustration of the probability
P
1
The probability
P
2
is illustrated in Fig.
5.47
.
P
2
¼ Pf
0
:
5
<X
2
g¼
0
:
4684
:
5.11 Questions
Q.5.1. Explain why a Rician variable approaches to a Rayleigh variable in the case
of a small values of
A
related to a deviation
s
(
A s
)?
Q.5.2. Explain why a Rician variable approaches to a Gaussian variable for high
values of
A
related to a deviation
s
(
A s
)?
Q.5.3. When does a lognormal variable approach a normal variable?
Q.5.4. There are
k
events in a Poisson flow of events in the random time interval
t
.
Which random variable can describe the random interval
t
?
Q.5.5. Why is a Poisson random variable said to be a “rare events variable?”
Q.5.6. (a) Which random variable has an equal mean value and standard deviation?
(b) Which random variable has an equal mean value and variance?
Search WWH ::

Custom Search