Digital Signal Processing Reference
In-Depth Information
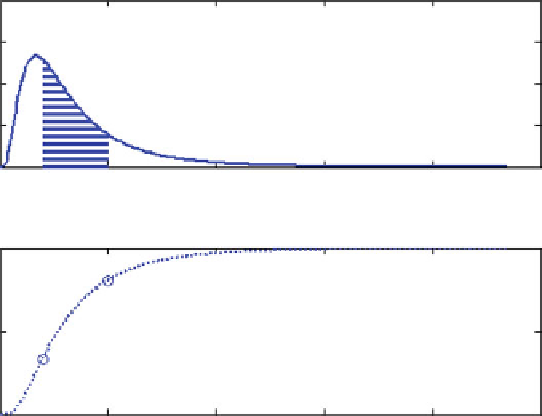
PROBABILITY: P2=P(B1<x<B2)
0.4
0.3
0.2
0.1
0
0
5
10
15
20
25
Range
PROBABILITY: P2, P2 = F(B2)-F(B1)
1
F2
0.5
F1
0
0
5
10
15
20
25
Range
Fig. 5.23
Probability
P
2
Second case
: The values of the normal standard deviations are decreased:
s
1
¼
0.2,
s
2
¼
0.1,
s
3
¼
0.08,
s
4
¼
0.05. Figure
5.25a
shows the values of the variables,
while Fig.
5.25b
shows their corresponding estimated densities.
Exercise M.5.4
(MATLAB file:
exercise_M_5_4.m
). Show that the sum of the
independent lognormal variables is a lognormal variable.
The parameters of variables are
s
1
¼
0.6325,
s
2
¼
0.4472,
m
1
¼ m
2
¼
1.
Solution
The lognormal variables and their sums are shown in Fig.
5.26a
, while
their corresponding estimated densities are given in Fig.
5.26b
, thus confirming that
the sum is once again the lognormal variable.
Exercise M.5.5
(MATLAB file:
exercise_M_5_5.m
). Generate
N ¼
1,000
samples of a Rayleigh variable
X
with a parameter of
s
2
¼
1. Estimate and plot
the PDF and distribution.
Solution
The plot of the Rayleigh variable is shown in Fig.
5.27
. The estimated
Rayleigh PDF and the mathematical PDF are shown in Fig.
5.28
.
Figure
5.29
shows the estimated and mathematical distributions.
Exercise M.5.6
(MATLAB file:
exercise_M_5_6.m
). Find the probability that the
Rayleigh random variable with the parameter
s
2
¼
1, is less than
A
, and the
probability that the variable it is in the interval [
B
1
,
B
2
], where
A ¼
1 and
B
1
¼
0.5,
B
2
¼
1.5.
Search WWH ::

Custom Search