Digital Signal Processing Reference
In-Depth Information
a
b
0.35
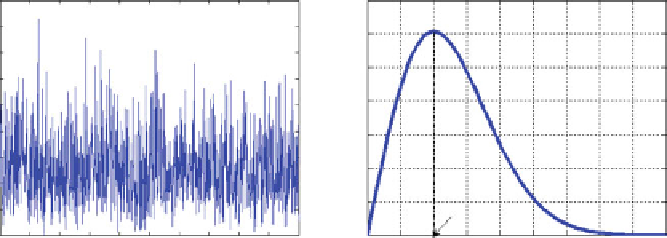
RAYLEIGH PDF
9
8
7
6
5
4
0.3
0.25
0.2
0.15
3
2
1
0
0
0.1
0.05
σ
0
100 200 300 400 500
n
600 700 800 900 1000
0
1
2
3
4
5
6
7
8
9
Range
Fig. 5.3
Rayleigh variable and density,
s
2
¼
4. (
a
) Rayleigh variable. (
b
) PDF
5.2.2 Distribution Function
The distribution function is obtained from (
5.26
) as:
x
2
2
s
2
d
x ¼
1
e
x
2
2
s
2
ð
ð
x
x
1
s
2
x
e
F
X
ðxÞ¼
f
X
ðxÞ
d
x ¼
:
(5.29)
1
0
The distribution function for
s
2
¼
4 is shown in Fig.
5.4
.
Note that for
x ¼ s
, the distribution is
F
X
ðsÞ¼PfX sg¼
1
e
0
:
5
:
(5.30)
Example 5.2.1
Find the probability that a Rayleigh signal is
c
times greater than the
s
.
Solution
From (
5.29
), we have:
PfX>csg¼
1
PfX csg¼
1
F
X
ðcsÞ¼
e
c
2
=
2
:
(5.31)
Table
5.1
shows the probabilities (
5.31
) for different values of
c
.
5.2.3 Moments
The mean value and the mean squared value are obtained from (
5.26
) as:
x
2
2
s
2
1
1
s
2
x
2
e
EfXg¼
d
x;
(5.32)
0


Search WWH ::

Custom Search