Digital Signal Processing Reference
In-Depth Information
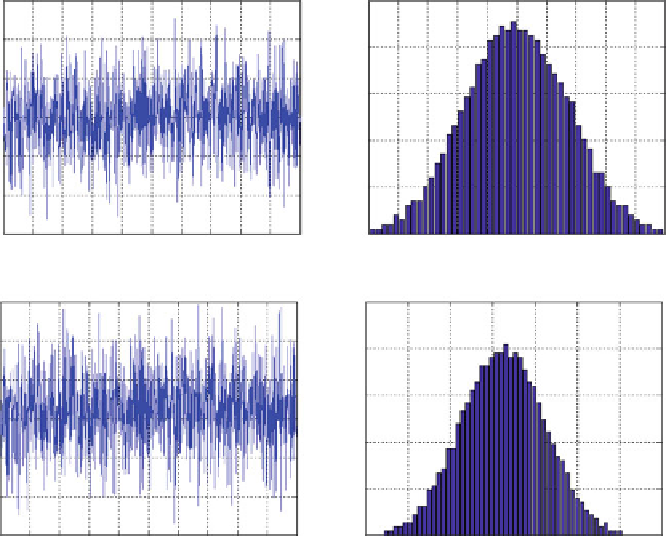
Sum of four uniform random variables
Sum of four uniform random variables
16
0.25
14
0.2
12
0.15
10
0.1
8
0.05
6
4
0
0
100 200 300 400 500 600 700 800 900 1000
5
6
7
8
9
10
11
12
13
14
15
n
range
Sum of five uniform random variables
Sum of five uniform random variables
18
0.25
16
0.2
14
0.15
12
0.1
10
0.05
8
6
0
0
100 200 300 400
500 600 700 800 900 1000
n
6
8
10
12
14
16
18
20
range
Fig. 4.41
Sum of uniform random variables and corresponding PDF estimations
Figure
4.42
compares the sum of five uniform random variables and the normal
random variable
N
(12.5, 3.75).
The PDF of the sum of the independent random variables is the convolution of
the corresponding densities. Denoting the uniform variables in the interval [1, 4] as
X
i
,
i ¼
1,
, 5, we have:
...
f
X
1
þX
2
¼ f
X
1
f
X
2
;
f
X
1
þX
2
þX
3
¼ f
X
1
f
X
2
f
X
3
;
f
X
1
þX
2
þX
3
þX
4
¼ f
X
1
f
X
2
f
X
3
f
X
4
;
f
X
1
þX
2
þX
3
þX
4
þX
5
¼ f
X
1
f
X
2
f
X
3
f
X
4
f
X
5
;
(4.241)
where * stands for the correlation operation.
Figure
4.43
shows the corresponding densities obtained by convolution of
uniform densities.
Search WWH ::

Custom Search