Biomedical Engineering Reference
In-Depth Information
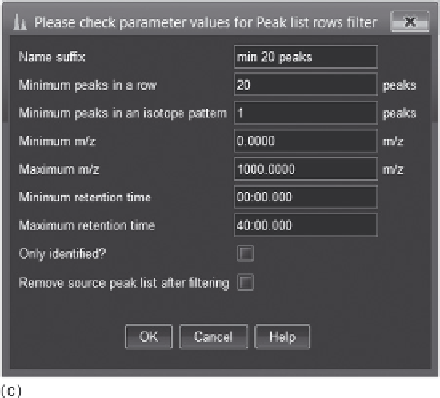
Figure 4.10
Continued
Log ratio analysis (Figure 4.12(b)) looks at the difference between two
groups. It is the ratio of the natural logarithm of the ratio of each group
average to the natural logarithm of 2. Principal component analysis
(Figure 4.12(c)) is a multivariate visualisation method. The fi rst principal
component shows a separation of the control samples from the wild type
and mutant. The second principal component shows a vertical trend. This,
at fi rst glance, appears to be related to ripening, but on closer inspection


Search WWH ::

Custom Search