Biomedical Engineering Reference
In-Depth Information
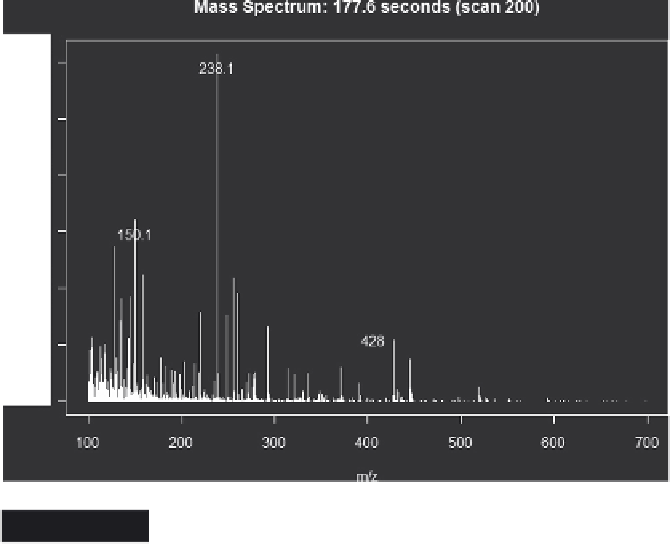
Figure 4.3
A mass spectrum produced from R (xcms)
The mass spectrum may also be plotted using the
plotScan
function:
plotScan(object, scan, mzrange = numeric(), ident = FALSE)
plotScan(object, scan, mzrange = numeric(), ident = FALSE)
where scan is the scan number, ident allows annotation of the peaks
interactively with the mouse, see Figure 4.3 as an example.
plotScan(x1,200,c(100,700),ident=TRUE) # plot spectrum
plotScan(x1,200,c(100,700),ident=TRUE) # plot spectrum
For a global overview of the LC-MS scan, a rotatable 3D image can be
generated via the '
plotSurf
' command within the RGL package [22], as
shown in Figure 4.4. Although only a few elementary features of XCMS
have been shown here, XCMS is a comprehensive metabolomics
processing package [19-21] and there are many good tutorials [23].
Visualising an LC-MS run in R is useful but lacks a certain degree of
interactivity. Another open source MS package is mzMine [24-26]
developed at Okinawa Institute of Science and Technology, Japan and
VTT Finland. It is a Java-based program and is therefore platform-
independent. mzMine works with a rich set of fi le types including Net
CDF, mzData, mzML, mzXML, Xcalibur Raw fi les and Agilent CSV


Search WWH ::

Custom Search