Biomedical Engineering Reference
In-Depth Information
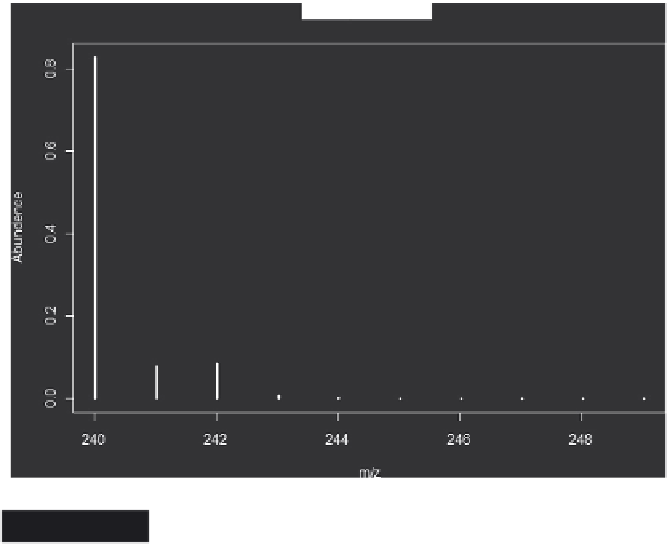
Figure 4.1
Isotope pattern for cystine
4.4.4 Data visualisation
A vital part of data analysis is the visualisation of data, it is good
practice to check the data visually for instrumental problems such as
drift or baseline shifts. The XCMS package may be used for this
purpose.
Examining a LC-MS spectrum in XCMS
The XCMS [16-20] package was written at the Scripps Center for
Metabolomics and Mass Spectrometry and is now provided as part of the
Bioconductor R package [15]. XCMS can be used to display the results
of an LC-MS scan using a few straightforward steps. In the example, data
from a single LCMS run are loaded into an '
xcmsRaw
' object designated
x1. The content and structure of this R object are viewed in order to
extract data for plotting.


Search WWH ::

Custom Search