Databases Reference
In-Depth Information
the dependency lattice is a tuple
<T,O>
, where
T
is an attribute of the
time
dimension and
O
is an attribute of the
organization
. Attached to each
such tuple
<T,O>
is an empty two-dimensional array, namely, a
cuboid
.
Each
cell
of the cuboid
<T,O>
is also a tuple
<t,o>
, where
t
and
o
are
attribute values
of the attribute
T
and
O
, respectively. The dependency
relation extends to be among cells. For example, a cell
<Y
1
,Bob >
depends
on the cells
<Q
1
,Bob >
,
<Q
2
,Bob >
,
<Q
3
,Bob >
,and
<Q
4
,Bob >
.
Hence, all cells also form a dependency lattice.
A base table with the schema (
quarter, employee, commission
)isused
to populate the data cube with values of a
measure
attribute
commission
.
Each record in the base table, a triple (
q, e, m
), is used to populate a cell
<q,e>
of the
core cuboid < quarter, employee >
, where
q
,
e
,and
m
are
values of the attributes
quarter
,
employee
,and
commission
, respectively.
Some cells of
< quarter, employee >
remain empty (or having the
NULL
value), if corresponding records are absent in the base table. If multiple records
correspond to the same cell, since the two attributes
quarter
and
employee
are not necessarily a key of the base relation, they are aggregated using the
aggregation function
SUM. All cuboids are then populated using the same
aggregation function. For example, in the cuboid
< year, employee >
, a cell
<Y
1
,Bob >
takes the value 8500, which is the total amount of the four cells
it depends on,
<Q
1
,Bob >
,
<Q
2
,Bob >
,
<Q
3
,Bob >
,and
<Q
4
,Bob >
.
An empty cell is deemed as zero (which depends on the aggregation function)
in aggregation.
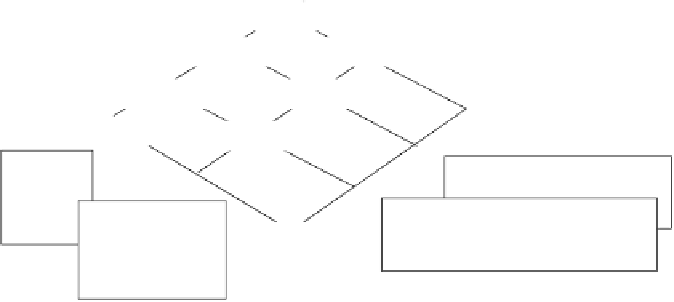
<all, all>
organization
time
<all, branch>
<year, all>
<all ,department>
<year, branch>
<quarter, all>
Q
1
2
…
<all employee>
<year, department>
<quarter, branch>
All
…
…
…
All
Bob …
Alice …
Jim …
Mallory …
…
Q
1
2
3
…
<year, employee>
<quarter, department>
Branch
1
…
…
…
….
…
Y
1
Y
2
…
Bob $8500 …
Alice $10000 …
Jim $6100 …
Mallory $12400 …
…
Q
1
…
2
3
Q
4
Q
5
…
Book
$10000 $6000 $11000 $9000 …
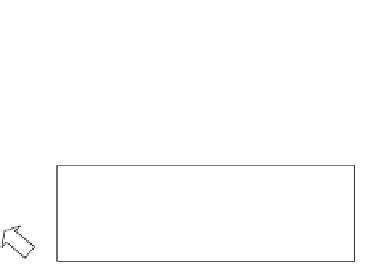
<quarter, employee>
CD
…
…
Q
1
2
3
Q
4
5
…
Bob
$1500 $1500 $5500
…
Alice
$4500 $5500
…
SUM
Jim
$3100
$3000 …
Mallory $6400
$6000 …
SUM
…
Fig. 1.
An Example of Data Cubes