Database Reference
In-Depth Information
spatial region on a map. For example, when computing annual rainfall for the
Denver area, the data used as input is the national daily rainfall numbers.
When retrieving the provenance of the annual rainfall, it is necessary to have
spatial knowledge to know that only the daily rainfall from Denver is used
from the input dataset.
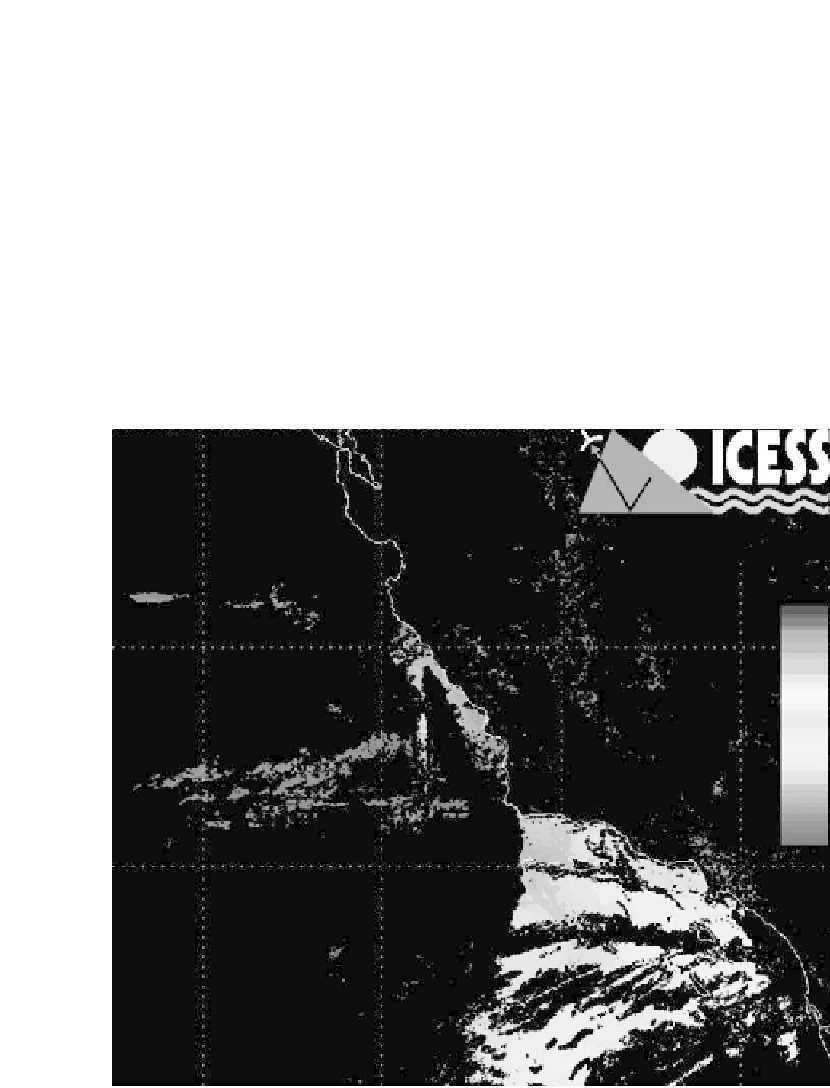
A more complex example is given in Frew and Base
83
for tracking the pro-
cessing of satellite images: Image data covering the western United States
and Pacific Ocean is retrieved from National Oceanic and Atmospheric Ad-
ministration (NOAA) satellites and is sent to a University of California Santa
Barbara-operated TeraScan ground station. These Advanced Very High Res-
olution Radiometer images are processed at the Institute for Computational
Earth System Science into two data products for Southern California and
the southwestern United States: a sea surface-temperature map and a near-
infrared albedo map. Figure 12.4 shows one such sea surface temperature map.
Computational: Earth System Science
University of California, Santa Barbara
36N
25
20
15
10
34N
Figure 12.4
(See color insert following page 224.) Map of sea surface tem-
perature taken February 18, 2009, 10:42 p.m. GMT.